La Calculadora de ROAS de Punto de Equilibrio para Shopify para Anuncios Rentables
Deja de adivinar la rentabilidad de tus anuncios. Usa nuestra guía de calculadora de ROAS de punto de equilibrio para encontrar tu objetivo real y escalar tu tienda Shopify con confianza.
Es una historia que todo fundador de Shopify conoce bien. Revisas tu panel de Meta Ads, ves un ROAS de 3.5x, y sientes esa sensación de éxito. Pero cuando miras tu cuenta bancaria al final del mes, los números simplemente no cuadran. Te quedas lidiando con datos fragmentados de diferentes plataformas, y el verdadero ROI de tu gasto publicitario es un completo misterio.
¿Qué pasa?
Por Qué el ROAS de Tu Panel Publicitario Te Está Mintiendo
Esta desconexión no es tu culpa; es una trampa común para las marcas DTC. Nos quedamos atrapados en métricas de plataforma que ignoran completamente el costo real de hacer negocios.
El Retorno sobre Gasto Publicitario (ROAS) de tu panel publicitario es una métrica de vanidad disfrazada. Solo conoce una cosa: los ingresos atribuidos al anuncio versus lo que pagaste por el anuncio. Tiene cero visibilidad sobre los costos reales que realmente determinan si ganaste dinero.
Ese ROAS glamoroso que ves en plataformas como Meta o Google no considera los gastos cruciales que suceden después del clic:
- Costo de Bienes Vendidos (COGS): El precio real que pagaste por el producto que acabas de vender.
- Envío y Cumplimiento: Todas las tarifas por recoger, empacar y llevar el pedido a tu cliente.
- Tarifas de Procesamiento de Pagos: Ese porcentaje que Shopify Payments u otra pasarela toma de cada transacción.
- Impuestos y Aranceles: Los otros costos que pueden reducir silenciosamente tus ingresos netos.
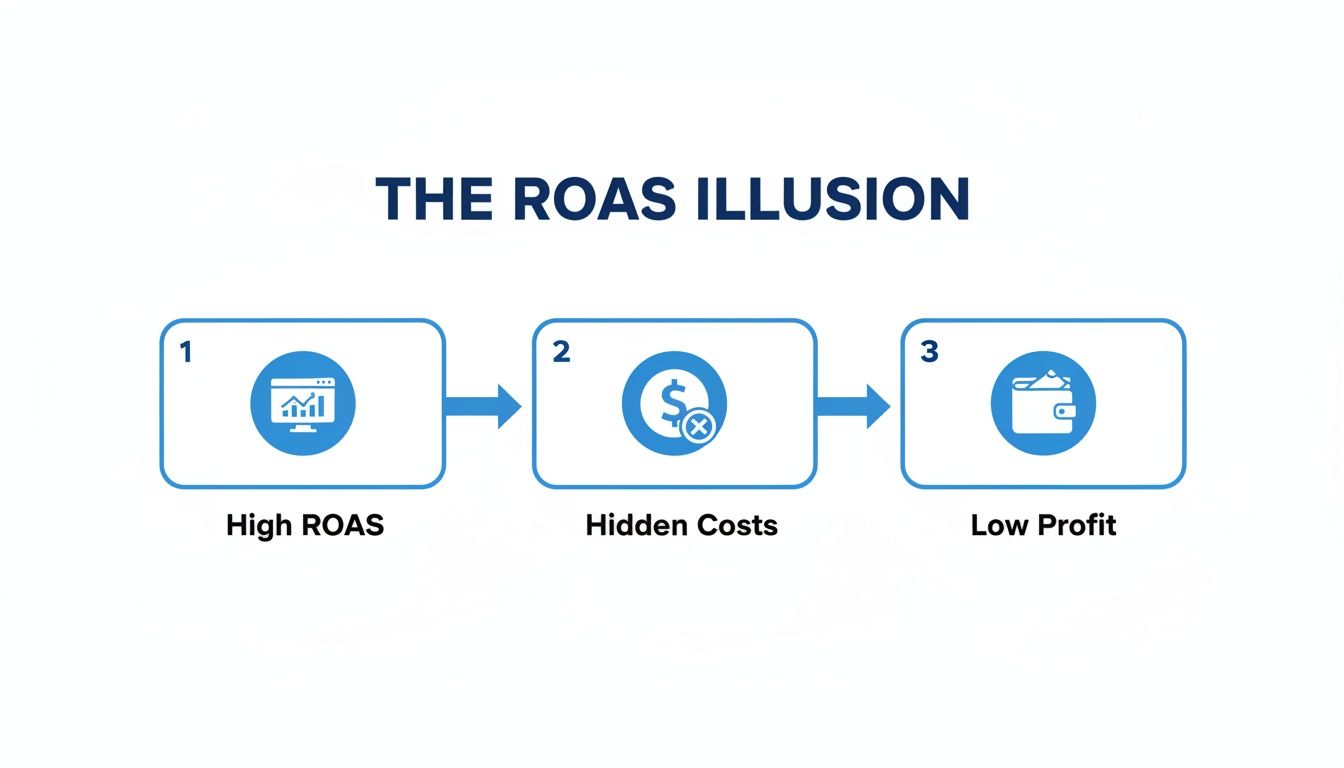
La Ilusión de Rentabilidad
Este punto ciego crea una peligrosa ilusión de rentabilidad. Una campaña que reporta un ROAS de 3.0x podría parecer una victoria, pero si tu margen de ganancia es solo del 25%, en realidad estás perdiendo dinero en cada venta que impulsa ese anuncio.
Estás vertiendo efectivo en campañas que están drenando lentamente tu negocio, mientras el panel parpadea en verde. Entender la diferencia entre lo que reportan las plataformas y la salud real de tu negocio es crítico. Para profundizar más, puedes explorar las distinciones entre ROAS vs ROI en nuestra guía detallada.
Aquí es donde tu ROAS de punto de equilibrio se convierte en el número más importante de tu kit de herramientas de crecimiento. No es solo otra métrica; es tu piso de rentabilidad—el ROAS mínimo absoluto que necesitas alcanzar para no perder dinero en tu gasto publicitario.
En esta guía, te mostraremos cómo cortar el ruido y calcular esta métrica esencial. Aprenderás cómo usarla para construir una estrategia de crecimiento verdaderamente rentable, convirtiendo el gasto publicitario incierto en un motor predecible para tu marca Shopify.
Muy bien, vamos a entrar en los detalles de lo que hace que una campaña publicitaria sea realmente rentable para tu tienda Shopify. Necesitamos calcular tu verdadero ROAS de punto de equilibrio.
Es mucho más simple de lo que suena y se reduce a una pequeña fórmula poderosa: 1 dividido por tu Margen de Ganancia. Eso es todo. Este único número es tu piso de rentabilidad—la línea en la arena donde dejas de perder dinero y empiezas a ganarlo en tu gasto publicitario.
Pero espera. La precisión de esa fórmula depende completamente de obtener tu margen de ganancia verdadero. Y no me refiero solo a restar el Costo de Bienes Vendidos (COGS) de tus ingresos. La verdadera rentabilidad siempre se esconde en los detalles.
Más Allá del COGS: Los Costos Reales Ocultos en Cada Venta
Para clavar esto, tienes que considerar todos los costos variables que erosionan cada venta individual. Estos son los gastos que aparecen cada vez que llega un pedido a tu tienda.
Para la mayoría de las marcas DTC, los sospechosos habituales son:
- Tarifas de Procesamiento de Pagos: Piensa en ese ~2.9% + 30¢ que Shopify Payments, Stripe, o PayPal toman de arriba.
- Gastos de Envío: El costo real de llevar ese paquete desde tu almacén hasta la puerta de tu cliente.
- Costos de Cumplimiento: Si usas un 3PL, esta es su tarifa por recoger, empacar y sacar el pedido por la puerta.
Olvidar estos costos es un error clásico. Crea una ilusión de éxito donde un ROAS alto en tu panel enmascara ganancias muy delgadas (o inexistentes). Así es como se ve esto en la práctica:
La conclusión principal aquí es que simplemente no puedes confiar solo en las métricas de plataforma. La rentabilidad solo se vuelve clara después de que hayas restado cada último costo variable vinculado a un pedido. Antes de profundizar más en ROAS, vale la pena entender los fundamentos de cómo calcular tu punto de equilibrio para tu negocio en general.
Un Ejemplo DTC del Mundo Real: La Sudadera de $80
Hagamos esto real. Imagina que manejas una marca de ropa Shopify, y estás vendiendo una sudadera por $80.
Hora de desglosar los costos:
- COGS: $30 (tu costo del fabricante).
- Tarifa de Cumplimiento: $4 (lo que tu 3PL cobra por pedido).
- Costo de Envío: $8 (el franqueo para enviar la caja).
- Tarifa de Shopify Payments: $2.62 (que es 2.9% de $80 + $0.30).
Suma todo, y tu costo variable total por pedido resulta ser $44.62. Esto te deja con una ganancia real de $35.38 antes de siquiera pensar en gasto publicitario. Eso significa que tu margen de ganancia verdadero es 44.2% ($35.38 dividido por el precio de $80).
Ahora, insertemos eso en nuestra fórmula: 1 / 0.442 = 2.26
Tu ROAS de punto de equilibrio es 2.26x.
Cualquier ROAS de campaña por debajo de 2.26x te está perdiendo dinero activamente, sin importar qué número rosado te esté mostrando Facebook o Google.
Si quieres ser aún más granular con tus propios números, armamos una guía con una calculadora de margen de ganancia de Shopify para ayudarte.
Esto no es solo teoría; se alinea perfectamente con lo que vemos en la vida real. Un ROAS promedio de eCommerce de 200-300% (o 2-3x) a menudo es solo el punto de equilibrio para muchas marcas. Un estudio incluso encontró que un ROAS bruto de $2.13 se tradujo en un retorno real de inversión de menos del 7% una vez que se consideraron todos los costos. Es un recordatorio duro de cuán peligrosas pueden ser esas métricas superficiales.
Por supuesto, procesar estos números manualmente es un gran comienzo. Pero cuando escalas, esto se convierte en un trabajo para herramientas de análisis impulsadas por IA que pueden entregar esta perspectiva en tiempo real, salvándote del infierno de las hojas de cálculo.
ROAS de Punto de Equilibrio por Margen de Ganancia
Esta tabla ilustra cómo cambia tu objetivo de ROAS de punto de equilibrio basado en el margen de ganancia de tu producto. Úsala como referencia rápida para entender tus requisitos de rentabilidad básica.
| Margen de Ganancia | ROAS de Punto de Equilibrio Requerido (Múltiple) | ROAS de Punto de Equilibrio Requerido (%) |
|---|---|---|
| 10% | 10.0x | 1000% |
| 20% | 5.0x | 500% |
| 30% | 3.33x | 333% |
| 40% | 2.5x | 250% |
| 50% | 2.0x | 200% |
| 60% | 1.67x | 167% |
| 70% | 1.43x | 143% |
| 80% | 1.25x | 125% |
Como puedes ver, mientras más alto sea tu margen, más bajo necesita ser tu ROAS para alcanzar el punto de equilibrio. Un negocio con márgenes delgados del 10% necesita un ROAS de 10x astronómico para mantenerse a flote, mientras que una marca con márgenes saludables del 60% solo necesita un 1.67x. Por esto es que conocer tus números es innegociable para cualquier fundador de Shopify serio sobre el crecimiento.
Convirtiendo Tu Objetivo ROAS en Decisiones Accionables
Conocer tu número de punto de equilibrio es solo la línea de partida. La verdadera magia sucede cuando lo usas para tomar decisiones más inteligentes en tus cuentas publicitarias. Este número se convierte en tu manual de jugadas, dándote la claridad y confianza para manejar campañas efectivamente.
Caminemos a través de cómo reaccionar cuando tus campañas están funcionando por encima, en, o por debajo de tu ROAS de punto de equilibrio.
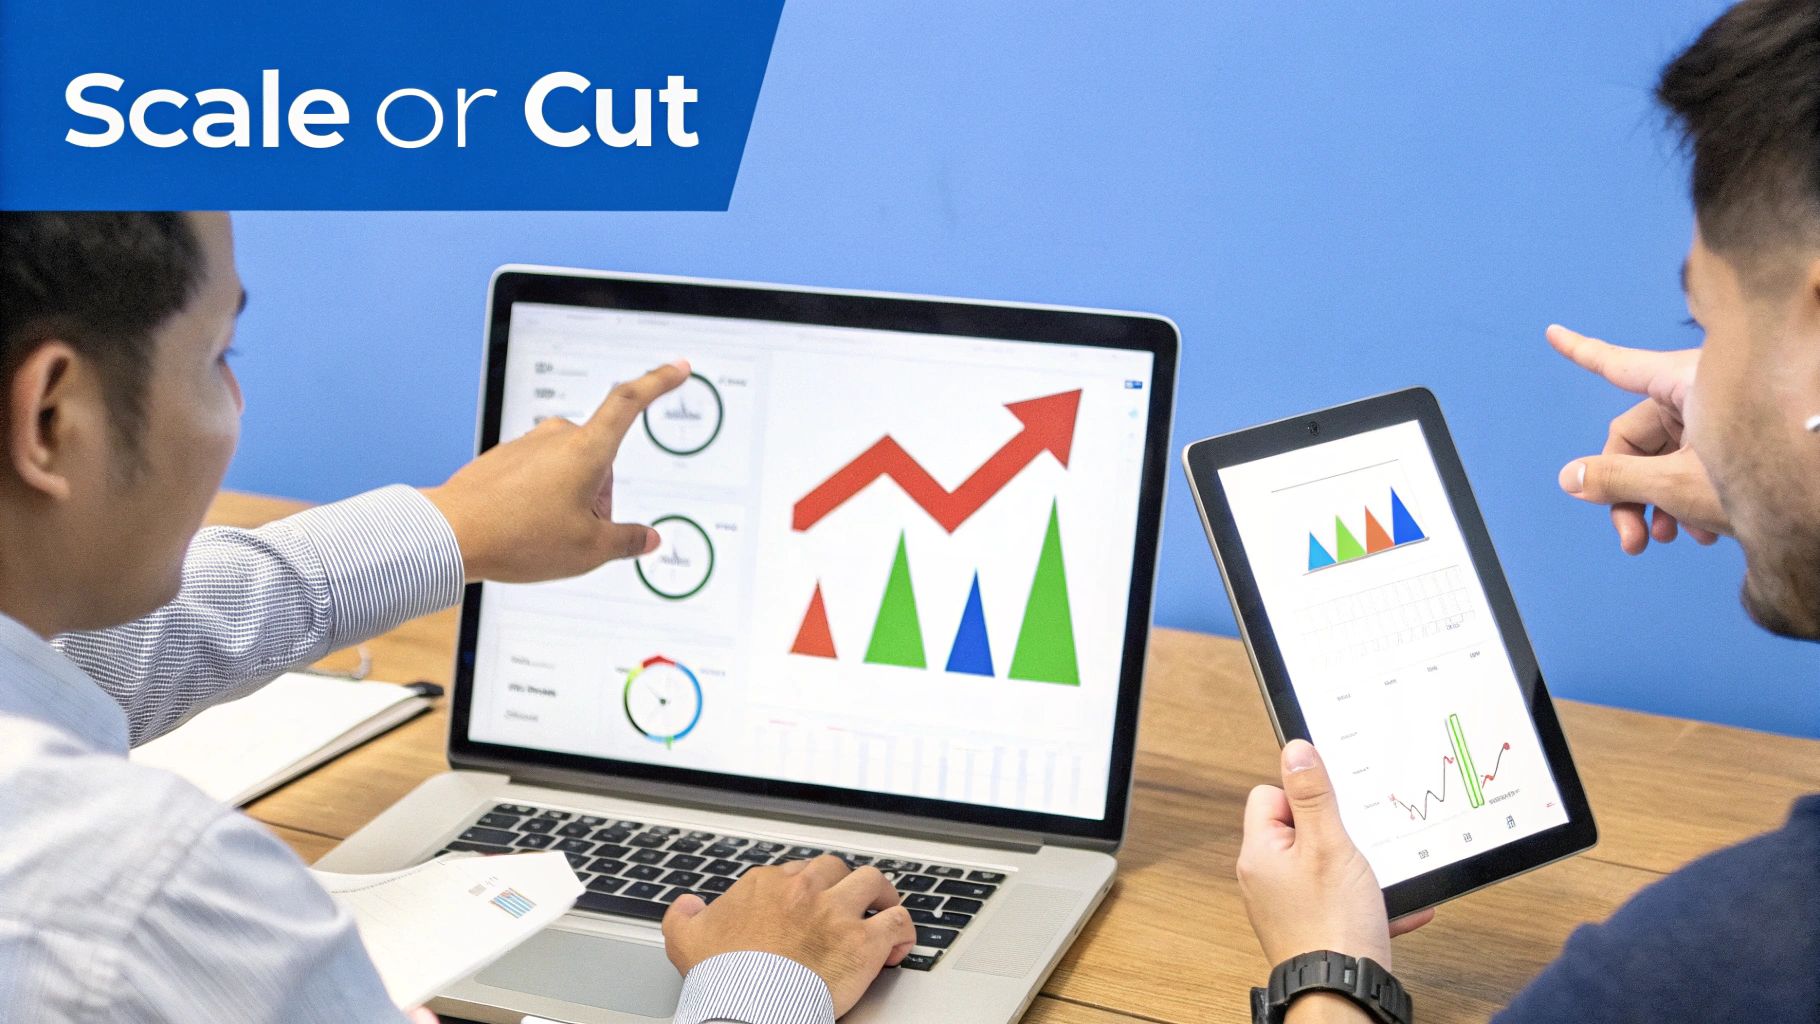
Cuando las Campañas Están Aplastando Tu ROAS de Punto de Equilibrio
Este es el escenario que todo mercadólogo DTC sueña. Cuando una campaña está consistentemente superando tu ROAS de punto de equilibrio, es una señal clara del mercado de que tu creativo, audiencia y oferta están perfectamente alineados. La tentación es ir con todo inmediatamente, pero el escalamiento inteligente es un proceso más controlado e incremental.
Así es como escalar inteligentemente:
- Aumentos Graduales de Presupuesto: No solo dobles el presupuesto de la noche a la mañana. Eso puede confundir el algoritmo de la plataforma publicitaria. En su lugar, auméntalo en 20-30% cada pocos días. Esto le da tiempo al algoritmo de encontrar más clientes sin resetear su fase de aprendizaje.
- Expansión de Audiencia: Usa tus conjuntos de anuncios con mejor rendimiento como plataforma de lanzamiento para nuevas audiencias similares. Comienza con una audiencia similar 1% ajustada de tus compradores y, si el rendimiento se mantiene, gradualmente prueba audiencias más amplias.
- Iteración Creativa: Ahora no es momento de parar de probar. Duplica lo que está funcionando creando nuevas variaciones de tus anuncios ganadores. Prueba diferentes ganchos, titulares o llamadas a la acción para ver si puedes exprimir aún más rendimiento de la campaña.
Cuando las Campañas Están Rondando en Punto de Equilibrio
Bienvenido a la zona neutral. No estás perdiendo dinero, pero tampoco estás ganando. Estas campañas no son fracasos; solo tienen potencial sin explotar que necesita un poco de optimización para volverse rentables. Es hora de arremangarse y hacer algunos ajustes finos.
Piensa en esto como un punto de control de diagnóstico:
- Refinamiento Creativo y de Copia: ¿Tu creativo publicitario realmente está parando el scroll? ¿Tu copia habla directamente a los puntos de dolor del cliente? A veces, pequeños ajustes aquí pueden tener un impacto desproporcionado en las tasas de clics y conversión.
- Pruebas A/B de Página de Aterrizaje: El problema podría no ser el anuncio mismo sino lo que sucede después del clic. Prueba diferentes titulares, imágenes hero o descripciones de producto en tu página de aterrizaje de Shopify para ver si puedes elevar tu AOV o tasa de conversión.
- Renegociación de Proveedores y Costos: Busca victorias más allá de la plataforma publicitaria. ¿Puedes conseguir un mejor trato de tus proveedores para bajar tu COGS? Incluso una pequeña caída en los costos de tu producto puede instantáneamente empujar una campaña en punto de equilibrio al verde.
Los números aquí son duros. Un ROAS 1:1 (o 100%) significa que solo estás recuperando tu gasto publicitario. Un 4:1 (400%) a menudo señala una campaña saludable y escalable. Cuando estás atascado en punto de equilibrio, incluso pequeñas mejoras en tu costo por clic o COGS pueden ser todo lo que necesitas para voltear una campaña hacia la rentabilidad. Estas métricas están todas estrechamente ligadas a tu costo de adquisición de cliente general, que desglosamos en nuestra guía dedicada.
Cuando las Campañas Están Rindiendo Por Debajo
Aquí es donde necesitas actuar decisivamente para parar de quemar efectivo. Si una campaña está consistentemente por debajo de tu ROAS de punto de equilibrio, es una señal clara de que algo está fundamentalmente roto.
No caigas en la trampa del apego emocional a una campaña. Los datos te están contando una historia; tu trabajo es escuchar y actuar.
Aquí hay un marco simple a seguir:
- Diagnosticar: Primero, descarta los culpables obvios. ¿Tu segmentación es muy amplia? ¿El creativo se está volviendo obsoleto?
- Optimizar: Si detectas un problema claro, haz un cambio específico y dale una ventana corta—digamos, 48-72 horas—para ver si el rendimiento mejora.
- Cortar: Si la campaña aún no puede alcanzar tu objetivo de punto de equilibrio, es hora de pausarla sin dudarlo. Reasigna ese presupuesto a tus campañas ganadoras o ponlo hacia probar nuevas ideas. Actuar rápidamente para salvar el 35% o más de un presupuesto fallido puede ser lo mismo que financie tu próximo gran ganador.
Errores Comunes Que Invalidan Tus Cálculos
Incluso con la fórmula correcta, tu cálculo de ROAS de punto de equilibrio es solo tan bueno como los datos que le alimentes. Como fundador de Shopify, estás tratando de navegar un campo minado de variables que pueden silenciosamente sabotear tu precisión y llevar a algunas decisiones seriamente costosas.
Piénsalo como una receta—pierde un ingrediente clave, y toda la cosa sabe mal. Estos errores comunes son los ingredientes ocultos que pueden invalidar completamente tus resultados.
Ventanas de Atribución Desiguales
Esta es una de las trampas más frecuentes que veo: comparar manzanas y naranjas con ventanas de atribución. Tu administrador de Meta Ads podría mostrarte resultados basados en una ventana de 7 días de clic, mientras que tu Google Analytics está configurado en un modelo de último clic de 30 días.
Esta no es solo una discrepancia menor; crea dos versiones completamente diferentes de la realidad. Meta podría reclamar crédito por una venta que GA4 atribuye a una búsqueda orgánica una semana después. Confiar en solo la vista de una plataforma te da una imagen peligrosamente sesgada de la verdadera rentabilidad de una campaña.
Conclusión Clave: Absolutamente necesitas una sola fuente de verdad. Aquí es donde entran las herramientas de análisis impulsadas por IA—mezclan datos de todas tus fuentes para darte una vista clara y unificada del rendimiento para que no te quedes lidiando con reportes conflictivos.
Ignorar Devoluciones y Reembolsos
¿Entonces qué pasa cuando ese pedido "rentable" se devuelve la próxima semana? Un número sorprendente de marcas Shopify cometen el error de calcular su ROAS de punto de equilibrio en ingresos brutos, ignorando completamente el impacto de las devoluciones.
Una alta tasa de devolución puede convertir una campaña aparentemente exitosa en un hoyo de dinero de la noche a la mañana. Si el 15% de tus pedidos están siendo reembolsados, tus ingresos netos reales son mucho menores que lo que tus plataformas publicitarias están reportando. Esto significa que tu objetivo de ROAS de punto de equilibrio real es mucho, mucho más alto de lo que piensas.
Tu cálculo debe estar basado en ingresos netos después de reembolsos para ser remotamente preciso.
Pasando Por Alto el Poder del LTV
Enfocarse solo en la rentabilidad de la primera compra es un caso clásico de ganar la batalla pero perder la guerra. Una campaña podría no alcanzar tu objetivo de ROAS de punto de equilibrio en la venta inicial, tentándote a pausarla inmediatamente.
¿Pero qué si esa misma campaña adquiere clientes que regresan y hacen dos compras más durante los próximos 90 días? Considerar el Valor de Vida del Cliente (LTV) puede reencuadrar completamente tu definición de éxito. Una campaña que parece un líder de pérdidas podría ser realmente tu canal de adquisición a largo plazo más valioso.
Esto es especialmente cierto para marcas DTC con fuerte retención de clientes. Para ver cómo todo esto se conecta con tu estructura de costos general, revisa nuestra guía sobre el ratio de margen de contribución.
Este no es solo un problema teórico. Globalmente, las marcas de eCommerce promedian un ROAS de 2.87:1, pero la competencia feroz a menudo empuja a los jugadores DTC más cerca de 2:1. Cuando un cálculo simple muestra que un margen de ganancia del 25% demanda un ROAS del 400% solo para alcanzar el punto de equilibrio, absolutamente no hay margen para error. Ignorar estos errores es un lujo que las marcas Shopify modernas simplemente no se pueden permitir. Puedes descubrir más perspectivas sobre estos benchmarks de ROAS en keycommerce.com.
¿Listo para Deshacerte de las Hojas de Cálculo?
Mira, luchar con Google Sheets para calcular tu ROAS de punto de equilibrio es un gran primer paso. Te hace pensar en los números centrales. Pero si somos honestos, las hojas de cálculo son estáticas. Son una foto en el tiempo, y simplemente no pueden mantener el ritmo cuando estás ejecutando un negocio DTC real. El procesamiento manual de datos lleva a reportes no confiables y ROI poco claro.
Aquí es donde te gradúas. Moverte a una plataforma de análisis impulsada por IA como MetricMosaic no se trata solo de ahorrar tiempo; se trata de convertir un proceso torpe y reactivo en un motor de crecimiento proactivo.
Pon Tu Seguimiento de Rentabilidad en Piloto Automático
Imagina un mundo donde nunca tengas que exportar otro CSV. Una plataforma de análisis de IA se conecta directamente a todo tu stack tecnológico de Shopify—Shopify, Meta Ads, Google Analytics, y todo lo demás. Junta todo automáticamente para darte un ROAS mezclado y verdadero en tiempo real. No más entrada manual de datos.
Esto no es solo un ahorrador de tiempo. Se trata de obtener una imagen precisa y al minuto de tu salud financiera. Para realmente afinar tu gasto publicitario, tienes que moverte más allá de la hoja de cálculo estática. Vale la pena explorar cómo una estrategia de IA para eCommerce puede cambiar fundamentalmente tu enfoque.
Obtén Respuestas Instantáneas de Tus Datos
El futuro del análisis no se trata de construir dashboards complejos. Se trata de tener una conversación. Esta es una tendencia de próxima generación conocida como análisis conversacional, y es un cambio de juego para fundadores ocupados.
En lugar de luchar con fórmulas y tablas dinámicas, puedes simplemente hacer una pregunta directa en inglés simple a un co-piloto de IA como MosaicLive de MetricMosaic.
Piensa en preguntar, "¿Cuál es el ROAS de punto de equilibrio para mi nueva colección de primavera?" y obtener una respuesta clara respaldada por datos en segundos. Así es como cortas la complejidad y llegas directo a la perspectiva, permitiéndote tomar decisiones más inteligentes, más rápido.
No se requiere analista.
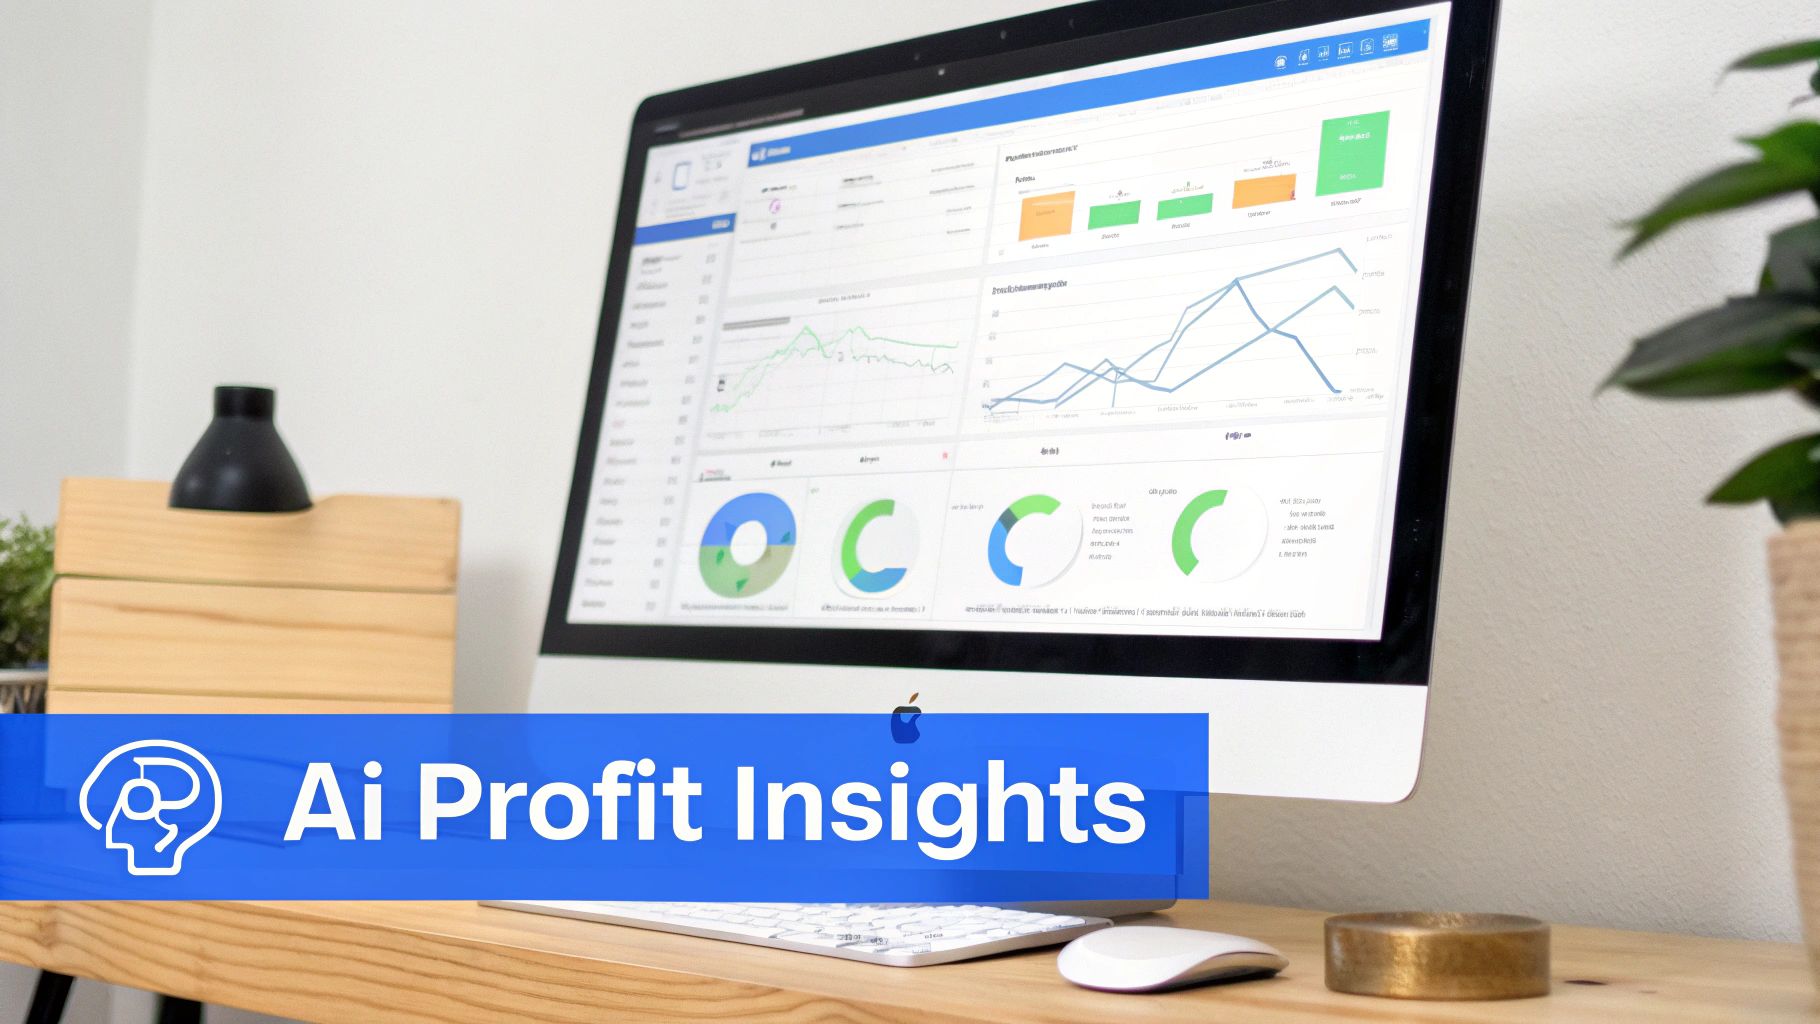
Así es como se ve tener una vista en vivo y consolidada de rentabilidad—algo que una sola plataforma publicitaria nunca podría darte.
Convierte Tus Datos en "Historias" Accionables
El mayor dolor de cabeza para la mayoría de los fundadores no es la falta de datos. Es descifrar qué diablos hacer con todo eso. Las plataformas de IA modernas finalmente están entendiendo esto, cambiando de solo mostrarte números a realmente contarte la historia detrás de ellos con perspectivas predictivas.
Por ejemplo, la función 'Stories' de MetricMosaic no solo señala una caída en el ROAS de una campaña. Te alerta proactivamente, explica por qué está pasando (tal vez los CPCs están subiendo o el AOV bajó), y te da una recomendación clara sobre qué hacer después.
Este enfoque impulsado por historias te da perspectivas como:
- Alertas Proactivas: Recibe un aviso en el segundo que la rentabilidad de una campaña está en riesgo.
- Análisis de Causa Raíz: Descubre el "por qué" detrás de los cambios de rendimiento sin tener que buscarlo tú mismo.
- Próximos Pasos Claros: Obtén sugerencias concretas, como mover presupuesto a un conjunto de anuncios ganador o refrescar tu creativo.
Hacer este salto de una calculadora de roas de punto de equilibrio manual a un sistema automatizado e inteligente es cómo construyes una operación resistente e impulsada por datos. Te libera para parar de procesar números y empezar a hacer los movimientos estratégicos que realmente hacen crecer tu tienda Shopify.
Preguntas Comunes Sobre ROAS de Punto de Equilibrio
Incluso después de que hayas dominado la fórmula, siempre surgen algunas preguntas. Es totalmente normal. Profundicemos en algunas de las más comunes que escucho de fundadores y mercadólogos de Shopify cuando primero empiezan a usar ROAS de punto de equilibrio.
¿Qué es un Buen ROAS para una Tienda Shopify?
Esta es la pregunta del millón de dólares, ¿no es así? Como estratega de crecimiento experimentado, puedo decirte que la única respuesta real es: depende completamente de tus márgenes de ganancia.
Escucharás un ROAS 4:1 (o 400%) mencionado como un benchmark general, pero seguir eso ciegamente es una receta para el desastre. Ese ROAS 4:1 podría realmente estar perdiendo dinero para una marca con un margen del 20%, que realmente necesita un ROAS 5:1 solo para cubrir sus costos.
Por otro lado, un ROAS 3:1 podría ser salvajemente rentable para una marca DTC con márgenes saludables del 50%, donde el punto de equilibrio es solo 2:1. Tu primer movimiento debería ser ignorar consejos genéricos y usar una calculadora de roas de punto de equilibrio para encontrar tu número. Ese es tu norte verdadero.
¿Con Qué Frecuencia Debería Recalcular Esto?
Piensa en tu ROAS de punto de equilibrio como una métrica viviente, no algo que estableces una vez y olvidas. Necesitas recalcularlo cada vez que cambien tus variables de costo clave.
Entonces, ¿cuándo deberías actualizarlo?
- Tus COGS cambian: Tal vez tu proveedor acaba de subir precios.
- Las tarifas de envío suben: Tu transportista ajusta sus tarifas.
- Las tarifas de procesamiento se actualizan: Tu pasarela de pagos cambia sus términos.
- Tu mezcla de productos cambia: Empiezas a vender mucho más de un producto hero de menor margen.
Para cualquier negocio DTC que se mueve rápido, tratar de mantener una hoja de cálculo actualizada es una batalla perdida. Es mucho más práctico usar una herramienta de análisis impulsada por IA que haga esto por ti en tiempo real. Esto asegura que tus objetivos estén siempre basados en lo que está pasando ahora mismo, no en lo que era cierto el trimestre pasado.
¿Cómo Afecta el Valor de Vida el Objetivo de Mi ROAS?
Aquí es donde las cosas se ponen realmente interesantes. Traer el Valor de Vida del Cliente (LTV) a la imagen puede cambiar completamente cómo ves el rendimiento de tus anuncios.
Una campaña podría tener un ROAS de primera compra que está por debajo de tu punto de equilibrio, haciéndola parecer un fracaso total. ¿Pero qué si esa misma campaña trae clientes que regresan y hacen dos o tres compras más? De repente, su ROAS basado en LTV podría ser increíblemente rentable.
Para marcas Shopify con retención de clientes sólida, tienes que analizar rentabilidad sobre una ventana más larga—digamos, 60 o 90 días. Esto te ayuda a ver el impacto verdadero y a largo plazo de tu gasto publicitario y te impide matar campañas que están silenciosamente construyendo una base de clientes leales.
Tu próximo paso es moverte de la conciencia a la acción. Deja de permitir que las métricas de vanidad de plataforma dicten tu estrategia publicitaria. Calcula tu verdadero ROAS de punto de equilibrio hoy, y si estás listo para automatizar todo este proceso y convertir los datos de tu tienda en una ventaja competitiva, MetricMosaic puede unificar todos tus datos de Shopify para darte la claridad que necesitas. Comienza tu prueba gratuita hoy y ve lo que el análisis impulsado por IA y basado en historias puede hacer por tu marca.