ROAS vs ROI: Which Metric Drives Real Profit for Your Shopify Store?
Struggling with ROAS vs ROI? This guide breaks down the key differences for Shopify brands, helping you move from vanity metrics to true profitability.
You see the notification: your latest Meta campaign just hit a 4x ROAS. The Shopify "cha-ching" sound is ringing, and on the surface, everything looks great. But when you check your actual bank account at the end of the month, the numbers just don't add up. Sound familiar?
This is the profitability trap that catches countless Shopify founders. You've been conditioned to believe that a high Return on Ad Spend (ROAS) is the ultimate sign of success, but it often just masks razor-thin margins and a mountain of hidden costs. It feels good, but it's pure vanity. Your ad platform reports are fragmented from your store's real financial data, leaving you with unreliable reports and an unclear picture of your actual ROI.
This guide is about cutting through that noise. We’re going to dig into the critical difference between ROAS and ROI, and I’ll show you exactly why focusing on ROAS alone can stall your growth. It's time to adopt an ROI-first mindset, using smarter analytics to get a true picture of your financial health and start making decisions that drive sustainable profit, not just top-line revenue.
The High ROAS Myth That Bleeds Shopify Stores Dry
Let’s get one thing straight. The difference between ROAS and ROI is actually pretty simple. ROAS (Return on Ad Spend) tells you how much revenue you're getting from a specific ad campaign. Meanwhile, ROI (Return on Investment) measures the overall profit of your entire business effort.
Deciding which one to focus on boils down to a single question: are you trying to check the tactical efficiency of an ad, or do you need a strategic view of your bottom-line profitability? For DTC founders, the answer has to be both, but your North Star must be ROI.

Why This Matters for DTC Brands
For any direct-to-consumer brand running on Shopify, getting this right is non-negotiable. ROAS is a perfectly fine metric for a media buyer trying to tweak a specific Google or Meta campaign. The problem is, it completely ignores the real-world expenses that eat into your profit:
- Cost of Goods Sold (COGS): The raw cost of making the products you sell.
- Platform and Payment Fees: Your monthly Shopify bill plus all those transaction fees.
- Shipping and Fulfillment Costs: The labor and postage for picking, packing, and shipping every single order.
- Overhead and Operational Costs: This bucket includes everything from team salaries and software subscriptions to warehouse rent.
High ROAS can make you feel successful while you're actually losing money on every sale. True profitability only comes into focus when you shift your primary measure of success from campaign revenue (ROAS) to overall business profit (ROI).
To make this distinction crystal clear, let's look at a quick side-by-side comparison before we dive into the formulas.
ROAS vs ROI: A Quick Comparison for Founders
This table breaks down the core differences at a glance. Think of it as your cheat sheet for understanding where each metric fits in your DTC business.
| Metric | What It Measures | Best For | Formula Focus |
|---|---|---|---|
| ROAS | The gross revenue generated for every dollar spent on advertising. | Assessing the tactical efficiency of a specific ad campaign or channel. | Revenue from Ads / Ad Cost |
| ROI | The total net profit generated from the entire investment, including all business costs. | Evaluating the strategic profitability of your entire marketing effort. | (Net Profit / Total Investment) x 100 |
As you can see, ROAS is all about revenue from a single source, while ROI looks at the entire picture—profitability across all your investments. Now, let’s get into the weeds and see how to calculate and use them in the real world of running a Shopify store.
Decoding the Core Metrics: What ROAS and ROI Really Mean
If you want to make profitable decisions for your Shopify store, you have to speak the language of growth. That means getting brutally honest about the two most important metrics on your dashboard: ROAS and ROI. They sound similar, but they tell two completely different stories about the health of your business.
Let's break these down in plain English, using the kind of scenarios DTC founders face every single day. Think of ROAS as your tactical spyglass and ROI as your strategic map.
What is ROAS? Return on Ad Spend
Return on Ad Spend (ROAS) measures the gross revenue you get back for every single dollar you put into advertising. It’s a front-line metric, the one you use to see if a specific ad campaign, ad set, or channel is pulling its weight. The math is simple and direct.
The formula for ROAS is:
ROAS = Total Revenue from Ads / Total Ad Cost
Let's say you run a DTC apparel brand on Shopify. You drop $1,000 on a Meta campaign to push a new line of hoodies, and that campaign brings in $4,000 in sales.
Your ROAS calculation is straightforward:$4,000 (Revenue) / $1,000 (Ad Cost) = 4
This is usually called a 4:1 ROAS or a 4x ROAS. It means for every dollar you fed that Meta campaign, you got four dollars back in top-line revenue. This is the go-to metric for your media buyer to tweak bids and creatives in real-time. It answers one simple question: "Is this ad working?"
What is ROI? Return on Investment
Return on Investment (ROI), on the other hand, tells you the net profit generated from your entire investment after you account for all your costs. It gives you a holistic, strategic view of whether you're actually making money. ROI looks way beyond just ad spend.
The formula for ROI is:
ROI = (Net Profit / Total Investment) x 100
Let's stick with that same hoodie campaign. We know it generated $4,000 in revenue from a $1,000 ad spend. But now, let's factor in the real-world costs of running your Shopify store.
- Cost of Goods Sold (COGS): The hoodies themselves cost you $1,500 to produce.
- Shipping & Fulfillment: You spent another $500 on packing and shipping.
- Platform & Transaction Fees: Shopify and your payment processor took a $200 cut.
- Total Investment: This is your ad spend plus all those other costs:
$1,000 + $1,500 + $500 + $200 = $3,200.
First, you need to find your net profit:$4,000 (Revenue) - $3,200 (Total Investment) = $800 Net Profit
Now, you can calculate the actual ROI:($800 Net Profit / $3,200 Total Investment) x 100 = 25%
The key takeaway is simple: ROAS tracks ad-level revenue, which is a measure of efficiency. ROI measures bottom-line business profit, which is a measure of success. A 4x ROAS feels great, but a 25% ROI is the number that tells you if you actually made any money.
Nailing this distinction is the first real step toward building a profitable DTC brand. It's the difference between celebrating vanity metrics and celebrating actual cash in the bank.
The Profitability Gap: Why a 4x ROAS Can Still Lose You Money
This is where the dashboards of Meta and Google collide with the P&L reality in your Shopify account. It’s a story every DTC operator knows well: a campaign looks like an absolute monster, flooding your store with sales and lighting up your ad manager, while silently siphoning profit from your bottom line.
It's a painful scenario, but one that plays out every single day.
Let's walk through a real-world example. Imagine you’ve launched a new product—a line of premium, sustainable coffee beans. You sink a decent budget into a slick video campaign and proudly hit a 4:1 ROAS.
The Anatomy of a "Successful" Campaign
On the surface, the numbers look incredible. You poured $5,000 into ad spend, and your Shopify dashboard shows $20,000 in revenue came straight from that campaign. The team is high-fiving over a 4x ROAS, and you're already sketching out plans to scale the budget.
But here’s the catch: ROAS only tells you about the money coming in. It conveniently ignores all the money going out.
So, let's pull back the curtain and look at what it actually cost to generate that revenue.
Where the Profit Really Goes
Getting from that shiny revenue number to actual, spendable profit means accounting for every single cost tied to fulfilling those orders. This is the part of the equation that ad platforms simply don't see.
Let's break down the true costs behind that $20,000 in sales:
- Cost of Goods Sold (COGS): Sourcing, roasting, and packaging your premium coffee beans ran you $9,000.
- Shipping & Fulfillment: Picking, packing, and shipping those orders to your new customers tacked on another $3,500.
- Transaction Fees: Shopify and your payment processor took their cut, which came out to $600.
- Ad Spend: And, of course, the initial $5,000 to run the campaign.
When you add it all up, your total investment wasn't just the ad spend. It was everything.
Total Investment = $9,000 (COGS) + $3,500 (Fulfillment) + $600 (Fees) + $5,000 (Ads) = $18,100
Now, let's do the real math:
Net Profit = $20,000 (Revenue) - $18,100 (Total Investment) = $1,900
Suddenly, the picture looks a lot different. While the campaign generated impressive revenue, the actual cash it put in your pocket was just $1,900. This brings us to the only metric that truly matters for survival—your ROI.
ROI = ($1,900 Net Profit / $18,100 Total Investment) x 100 = 10.5%
A celebrated 4x ROAS actually netted a modest 10.5% ROI. This isn’t a total failure, but it perfectly illustrates the dangerous gap between what looks good in an ad report and what’s actually good for business.
This isn’t a rare occurrence. An in-depth report on ad spend statistics highlights cases where a positive 2.13 ROAS translated to a meager 6.7% ROI once full costs were factored in. Even worse, some campaigns with a decent ROAS ended up with a negative ROI of -16.67% because total costs completely swallowed the revenue.
A Better Metric: Profit on Ad Spend (POAS)
This profitability gap is exactly why savvy operators are moving beyond ROAS. A much smarter metric to bridge this gap is Profit on Ad Spend (POAS). Instead of measuring revenue per ad dollar, POAS measures profit per ad dollar.
The formula is simple:
POAS = Gross Profit from Ads / Total Ad Cost
Let’s apply this to our coffee example:
Gross Profit = $20,000 (Revenue) - $9,000 (COGS) = $11,000
POAS = $11,000 (Gross Profit) / $5,000 (Ad Cost) = 2.2x
This 2.2x POAS gives you a far more honest view of your campaign’s performance. It tells you that for every dollar you spent on ads, you generated $2.20 in gross profit—the money you can actually use to cover operations and grow the business. It’s the essential first step from the vanity of ROAS to the sanity of true profitability.
Choosing the Right Metric for the Right Job
In the world of DTC analytics, ROAS and ROI aren't competitors. They’re different tools for different jobs, and knowing when to use each is what separates good marketers from great business operators.
Think of it like a pilot. They use one instrument to check airspeed (a real-time, tactical reading) and another to check the overall fuel level for the entire journey (a strategic overview). Both are critical, but for entirely different reasons. Getting this right aligns your entire team, preventing costly mistakes where profitable opportunities get overlooked and budgets get burned on campaigns that only look good on the surface.
This decision tree breaks down how a simple question about ad performance should always lead to a deeper analysis of true profitability.
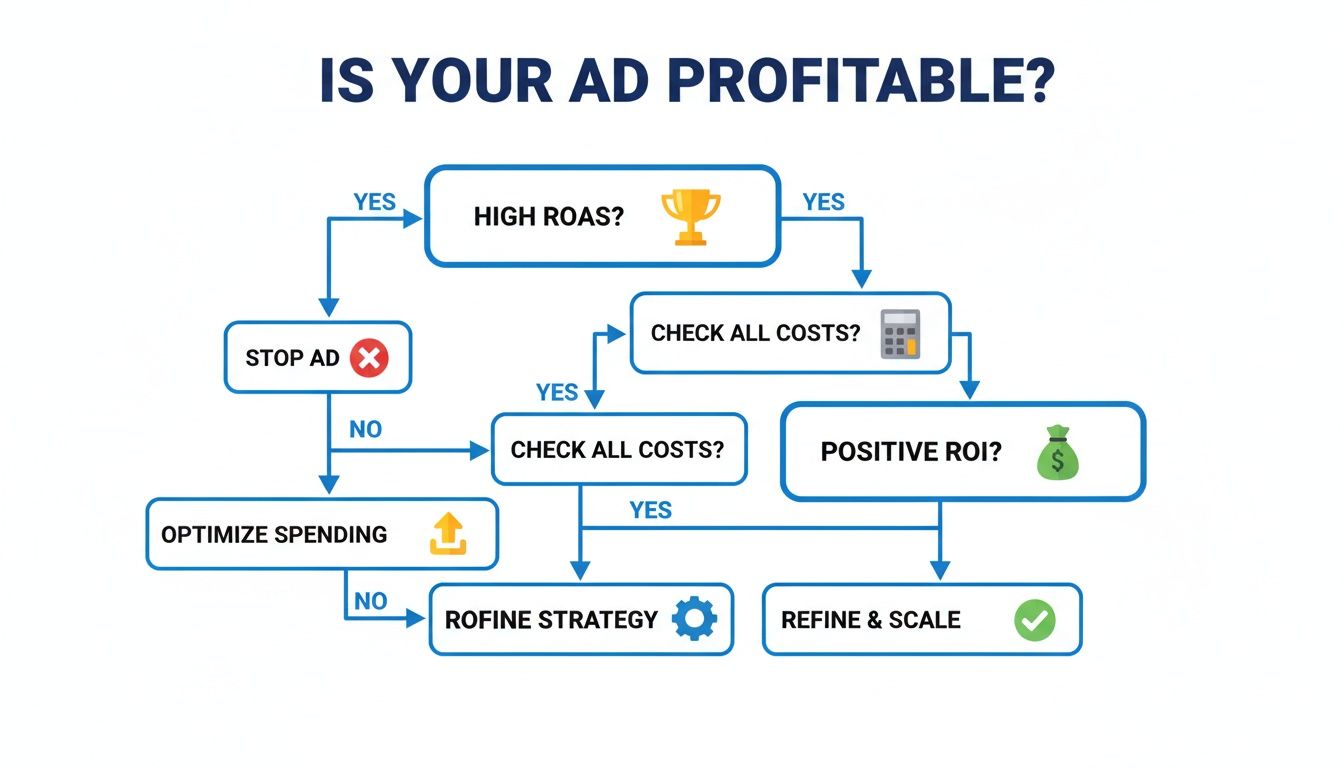
As you can see, a high ROAS is just the first checkpoint, not the finish line. The road to scalable, profitable growth always runs through a final check on ROI.
ROAS: The Performance Marketer’s Go-To Metric
For your media buyers and performance marketers, ROAS is the essential tactical metric. It’s the immediate, in-the-weeds feedback they need to optimize campaigns daily, or even hourly. It’s built for speed and quick, decisive action at the campaign level.
Your team should be laser-focused on ROAS when they’re asking questions like:
- Is the new TikTok video creative outperforming our static image ad?
- Should we pump more budget into this specific audience segment on Google Ads?
- Which ad set on Meta is generating the most efficient top-line revenue?
ROAS is the pulse of your advertising. A strong ROAS tells you that your creative, targeting, and offer are hitting the mark, turning ad dollars into immediate revenue. But—and this is a big but—it says nothing about profit. Industry data often shows that a platform like Google Ads might deliver an average 2:1 ROAS, but that figure is completely disconnected from the margins of the products you sold.
This is exactly why ROAS is the perfect tool for quick tactical adjustments but falls short for judging overall business health. For a deeper dive into these platform variances, you can discover more insights about ROI benchmarks for developer ads.
ROI: The Founder’s North Star Metric
For founders, CEOs, and anyone managing the P&L, ROI is the ultimate strategic metric. It cuts through the noise of vanity metrics to answer the one question that really matters: "Are we actually making money?"
ROI forces a holistic view by baking in all the costs, giving you a true measure of profitability. As a founder or brand operator, you should live and breathe ROI when tackling the big-picture questions:
- Is our entire paid acquisition channel profitable after factoring in COGS, shipping, and fulfillment?
- How should we set the marketing budget for next quarter to ensure sustainable growth?
- Which marketing initiatives are delivering the highest net profit to the business?
ROAS tells you if your ads are working. ROI tells you if your business is working. A founder’s job is to focus on the latter, using ROAS as a key signal, not the main event.
This distinction is crucial. Without it, your media buyer might scale a campaign with a fantastic 5x ROAS that, unbeknownst to them, is driving a negative ROI because it's pushing a low-margin product. The framework below clarifies who should focus on what, and when.
The DTC Operator's Framework for ROAS vs ROI
Here's a simple framework to help your team align on which metric to prioritize based on their role and the decision at hand. Think of this as your cheat sheet for focusing on the right numbers at the right time.
| Decision Factor | Focus on ROAS When... | Focus on ROI When... |
|---|---|---|
| Role | Performance Marketer, Media Buyer, Agency Partner | Founder, CEO, Finance Lead, Head of Growth |
| Objective | Campaign Efficiency & Optimization | Overall Business Profitability & Financial Health |
| Time Horizon | Short-term (Daily/Weekly) | Long-term (Monthly/Quarterly/Annually) |
| Key Question | "Is this ad creative/audience/channel converting well?" | "Is our marketing investment generating real profit?" |
| Typical Decisions | - Pausing underperforming ads - Shifting budget between ad sets - A/B testing creative and copy |
- Setting the overall marketing budget - Deciding which channels to invest in - Evaluating the company's growth strategy |
Using this framework ensures that your team isn't just chasing high ROAS numbers that look good in a report but is instead driving decisions that contribute directly to the bottom line. It creates a system where tactical optimizations (ROAS) directly support the overarching strategic goals (ROI).
Automating Profit Analytics with AI
If you're a Shopify founder, you know the pain of trying to calculate a true, blended ROI. It usually means exporting a mountain of CSV files from Shopify, Meta, and Google, then trying to stitch them all together in a spreadsheet that seems to grow more complex by the minute. It’s not just a headache—it’s slow, full of potential errors, and makes it nearly impossible to get a real-time pulse on your profitability.
Frankly, that kind of manual data-wrangling is a thing of the past. The real solution now lies in AI-powered analytics platforms that wipe away all that complexity.

Think of these tools as a central hub. They automatically pull in data from your Shopify store, all your ad platforms, your COGS data, and even your fulfillment software. Instead of fighting with a dozen different reports, you get one unified, reliable source of truth for your business’s financial health. AI simplifies this analytics work, replacing hours of manual data crunching with automated, story-driven insights.
From Manual Work to Predictive Intelligence
The real magic of AI here isn't just about saving you a few hours. It’s about unlocking the kind of deep, strategic insights that used to be out of reach for most DTC brands. This is where next-gen trends like conversational analytics and predictive insights come into play, turning your complex data into a clear story you can act on.
This is how you graduate from just tracking metrics to making predictive, profit-driven decisions.
By automating all the data integration, AI-powered platforms like MetricMosaic get you out of the spreadsheet grind for good. You can finally focus on the strategic decisions that actually grow your business—like optimizing for profit, not just chasing a high ROAS.
AI makes complicated concepts suddenly simple and accessible:
- Customer Acquisition Cost (CAC) Payback Period: How long does it actually take to earn back the money you spent to get a new customer? AI can calculate this on the fly, showing you which channels are bringing in profitable customers the fastest.
- Customer Lifetime Value (LTV) to CAC Ratio: This is the holy grail metric. It tells you the long-term value of your customers compared to what it cost to acquire them. AI models can even predict future LTV, helping you invest smarter today.
Seeing the Bigger Picture Beyond First Purchase
This is where AI-driven analytics really shines—connecting short-term campaign results with long-term customer value. It’s also where the whole ROAS vs. ROI debate becomes crystal clear.
Let's say an AI analytics platform looks at one of your recent campaigns and shows a modest 2.5x ROAS. Your first instinct might be to slash the budget. But then the AI digs deeper and uncovers something critical: the customers from this campaign have a 30% higher LTV than customers from any other channel.
They come back to buy more often, their Average Order Value (AOV) is higher, and they're less likely to churn. All of a sudden, that "average" campaign is actually a brilliant long-term investment that’s acquiring your most valuable customers. You would almost certainly miss that insight if you were just looking at platform-reported ROAS.
We see this all the time. A $2,000 Google Ads spend might generate $8,000 in revenue for a solid 4:1 ROAS, but the true ROI can fall off a cliff once you factor in all business costs. We've seen a $1,800 investment net only $600 in actual profit, which is just a 33% ROI. After post-iOS privacy changes caused an industry-wide 15% drop in ROAS, the smartest brands shifted their focus to ROI and saw profit gains of up to 20% because they were tracking both. This proves why you need robust tools that can automatically calculate true ROI by pulling in all your cost data.
This is what AI does best: it turns complexity into clarity. It connects the dots between ad spend, customer behavior, and your bottom line, giving you the confidence to build a more resilient and successful DTC brand.
From Insight to Action: Building a Profitable Growth Engine
Getting a handle on ROAS vs. ROI is a great first step. But knowing the difference is just trivia if you don't do anything with it. The real work starts when you turn that knowledge into a repeatable, profitable growth engine for your Shopify store.
It all starts with answering one non-negotiable question: What is my break-even ROAS?
This is the absolute floor. It's the minimum ROAS you have to hit on any given campaign just to cover your product and fulfillment costs without actively losing money. Anything less is a guaranteed loss, no matter what the ad platform's dashboard says.
Calculating Your Break-Even ROAS
To nail this down, you first need to know your profit margin before you even think about ad spend. The formula is refreshingly simple.
Break-Even ROAS = 1 / Profit Margin
Let's walk through it. Imagine you're selling a product for $100.
- Your Cost of Goods Sold (COGS) is $40.
- Shipping and fulfillment add another $10.
Your total cost per unit is $50, which leaves you with $50 in profit. That's a 50% profit margin.
So, your break-even ROAS would be:1 / 0.50 (Profit Margin) = 2
This means you need a 2x ROAS just to get back to zero on that product. If you're running a campaign and seeing a 1.8x ROAS, you're lighting money on fire with every single sale. Knowing this number for your key products gives you an instant, data-backed guardrail for all your advertising. This is a practical, actionable takeaway you can use today to improve performance.
The Mindset Shift: From Ad Platform to Business Platform
Once you've got your break-even points established, it’s time for a fundamental shift in how you think. Stop trying to run your business from inside the Meta and Google ad dashboards. Their job is to get you to spend more money. Your job is to make more money.
The ultimate goal for any DTC founder is to evolve from fragmented campaign reports to a unified, real-time view of blended business ROI. This is how you move from just driving sales to building a resilient, sustainable, and truly successful brand.
This evolution requires centralizing your data. It means getting everything in one place. An AI-powered analytics platform like MetricMosaic can unify data from Shopify, your ad accounts, and your cost data to give you that single source of truth. It's designed to show you the real-time impact of your ad spend on your bottom line, not just top-line revenue.
By shifting your focus from campaign-level ROAS to total business ROI, you completely change the questions you ask. It’s no longer, "How can I get a higher ROAS?" Instead, you start asking, "How can I invest this next dollar to generate the most profit?"
That subtle change in perspective is what separates brands that struggle from brands that scale. It's the next step from awareness to action.
A Few Common Questions
Even after you nail down the definitions, some practical questions always pop up for Shopify founders. Let's tackle a few of the most common ones I hear.
What’s a Good ROAS for My Shopify Store?
Honestly, there's no magic number. A “good” ROAS is completely tied to your profit margins. A brand with a healthy 70% margin might be printing money with a 3x ROAS, but a store with a tighter 30% margin would be in the red at that same level.
Forget chasing universal benchmarks. Instead, figure out your break-even ROAS. This is the absolute floor—the minimum you need to cover your product costs and other variable expenses. The formula is simple: 1 / Profit Margin. So, if your profit margin is 40%, you need at least a 2.5x ROAS just to keep from losing money on that ad spend.
Can I Have a High ROAS but Still Lose Money?
Absolutely. This is probably one of the most painful and common traps for DTC brands. It happens when all the other costs—your COGS, shipping, fulfillment, and transaction fees—add up to more than the revenue left over after you've paid for the ads.
For instance, a 4x ROAS feels great on paper, but if it's for a low-margin product, you could easily have a negative ROI. This is precisely why you can't live and die by the numbers inside your ad platform dashboards. You have to connect those ad costs to your total business profitability. This is where an AI-powered analytics platform can step in, connecting the dots automatically so you don’t accidentally scale campaigns that are secretly bleeding you dry.
How Do I Figure Out ROI with Multiple Marketing Channels?
Trying to calculate a blended ROI across all your channels with a spreadsheet is a special kind of hell. But modern tools make this straightforward. An AI-powered analytics platform can integrate with all your data sources—Shopify, Meta, Google, Klaviyo, you name it—and pull everything into one unified view.
It automatically attributes revenue and allocates costs where they belong, giving you a real-time, blended ROI for your entire marketing ecosystem. This lets you see if your overall investment is paying off, even if one channel has a lower ROAS but happens to be bringing in incredibly high-LTV customers.
Which Is More Important: LTV or ROI?
They aren't competitors; they're partners. ROI gives you a snapshot of your profitability right now. Customer Lifetime Value (LTV) tells you the story of your profitability over time.
A high ROI is fantastic, no question. But the real homerun is a campaign that delivers a solid ROI and acquires customers with a high LTV. That's the engine for sustainable growth. AI can help here by predicting the future value of customer cohorts from different channels, helping you balance today's profits with long-term brand health. Focusing on both is how you build a resilient business, not just a one-hit wonder.
Ready to stop guessing and start knowing your true profitability? MetricMosaic is the AI-powered analytics co-pilot designed for Shopify brands that connects your data to deliver clear, profit-driven insights. Move beyond vanity metrics and build your growth engine on the numbers that really matter. Start your free trial today and see the full story your data is telling you.