Contribution Margin Ratio: The Profit Metric Every Shopify Founder Needs to Master
Unlock how the contribution margin ratio affects Shopify profits and learn actionable pricing, ad spend, and cost strategies that drive profitability.
Running a Shopify store can feel like you're stuck on a treadmill. Your revenue is climbing, the sales notifications are buzzing, but when you check your bank account, the numbers just don't add up. It’s a classic, frustrating scenario for DTC founders, and it usually stems from a single problem: you're tracking vanity metrics, not profit.
You’re executing the top-line growth playbook—more traffic from your Meta ads, a higher AOV, a growing customer list. But revenue alone doesn't pay the bills. The real challenge is sifting through fragmented data from Shopify, your ad platforms, and your 3PL to figure out how much cash you’re actually keeping from each sale.
You might have a "bestseller" that's secretly bleeding cash on every order because of high shipping costs or payment processing fees. Or a marketing campaign with a killer ROAS that’s actually tanking your profitability. Without a clear view, you’re flying blind.
This is where the contribution margin ratio comes in. It’s not some stuffy accounting term; it’s the most critical metric for understanding your store's true financial pulse. It answers one simple question: For every dollar that comes in, how many cents are left to cover your fixed costs and generate actual profit?
For Shopify and DTC brands, mastering this metric is the difference between simply growing and growing profitably. It turns a complex mess of data into a clear roadmap for sustainable success.

Why Your Revenue Growth Might Be a Vanity Metric
Ever feel like you're stuck on a treadmill? Your Shopify revenue is climbing, the sales notifications are buzzing, but your bank balance is stubbornly flat. It’s a classic, frustrating scenario for DTC founders.
You're executing the top-line growth playbook perfectly—more traffic, more sales, higher AOV. The problem is, revenue alone doesn't tell you how much of that money you're actually keeping.
This disconnect pops up when you're only tracking traditional metrics that don't paint the full picture. Sure, you're watching your Cost of Goods Sold (COGS), but what about all the other expenses that scale up with every single order you ship?
- Shipping & Fulfillment: The real cost to pick, pack, and ship from your 3PL.
- Payment Processing Fees: That slice Shopify Payments or Stripe takes from every dollar.
- Sales Commissions: What you pay out to your sales reps or affiliates.
- Packaging: The custom boxes, mailers, and inserts that go into each shipment.
If you aren't factoring these in, you're flying blind. You could have a "bestseller" that's secretly bleeding cash on every order. Or a marketing campaign with a killer ROAS that’s actually tanking your profitability. You need a metric that connects the dots between sales and genuine profit. For a deeper dive, check out our guide on essential eCommerce performance metrics.
For a growing Shopify brand, the contribution margin ratio is the missing puzzle piece. It shifts your focus from simply making sales to making profitable sales, providing the clarity needed for sustainable growth.
This is exactly where the contribution margin ratio steps in. It’s not some stuffy accounting term; it’s the most critical metric for understanding your store's true financial pulse. It answers one simple question: For every dollar that comes in, how many cents are left to run the business and generate profit?
Getting a handle on this ratio empowers you to make smarter decisions on pricing, ad spend, and inventory. It turns your Shopify data from a confusing mess into a clear roadmap for real, sustainable growth.
What Contribution Margin Ratio Reveals About Your Business
Let's get straight to it. The contribution margin ratio isn't just another piece of accounting jargon to ignore—it’s the pulse of your Shopify store's financial engine and its true potential to scale.
In plain English, it shows you the percentage of every dollar of revenue left over to pay your fixed costs and, most importantly, generate profit. For every dollar a customer spends, how many cents are you actually keeping to run and grow the business?
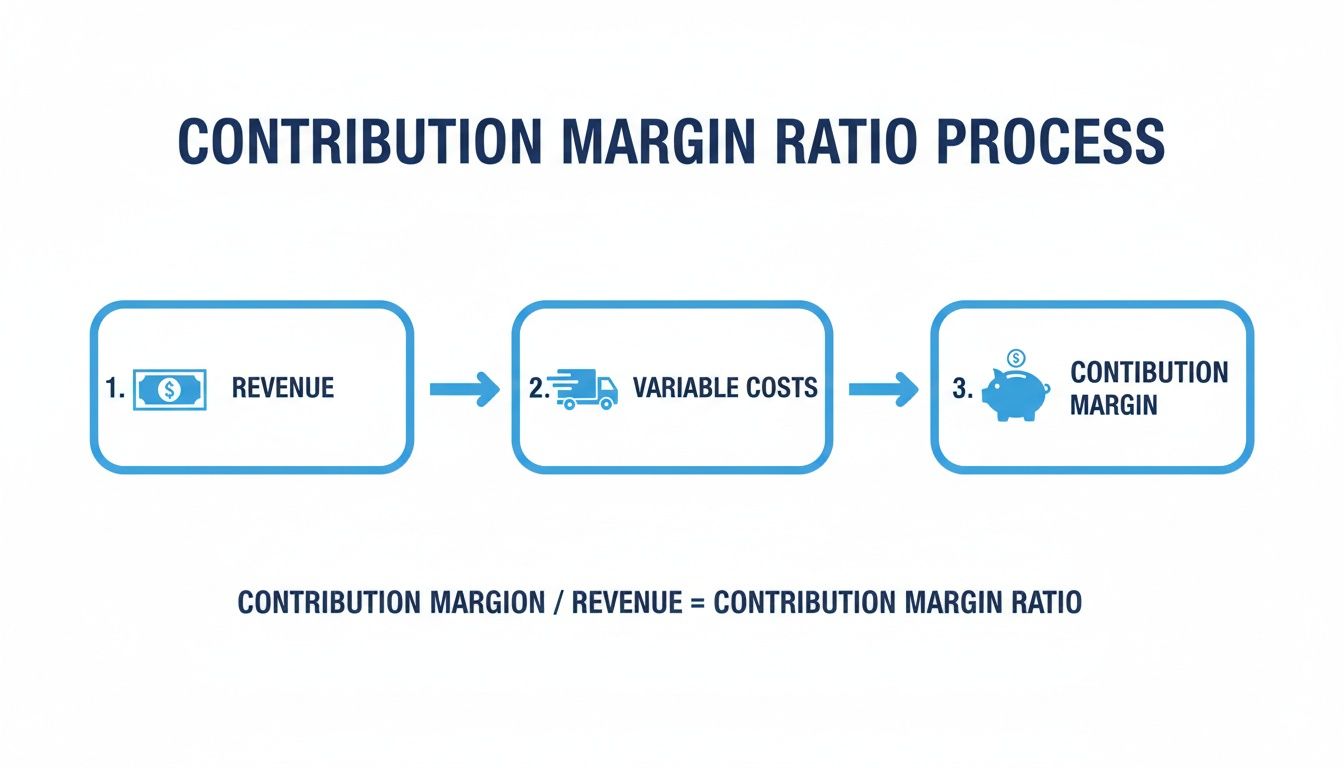
The formula is beautifully simple:
Contribution Margin Ratio = (Revenue - Variable Costs) / Revenue
This little calculation tells the real story behind your sales numbers. It directly determines your ability to absorb rising ad costs on platforms like Meta and Google, fund new product development, and scale your marketing with confidence instead of just burning cash.
A Clearer View Than Gross Margin
A lot of DTC founders get hung up on gross margin, but for a growing eCommerce brand, it often hides critical parts of the story. Gross margin typically just subtracts the Cost of Goods Sold (COGS) from your revenue, and that’s it.
The contribution margin ratio is so much more insightful because it forces you to account for all the variable costs that tick up with every single sale—not just what it cost to make the product. This is a game-changing distinction for Shopify brands.
- Gross Margin Focuses On: The cost to produce the product.
- Contribution Margin Focuses On: The total cost to make and deliver a sale.
To help clarify this, let's break down the key differences.
Contribution Margin Ratio vs Gross Margin Ratio
| Metric | Contribution Margin Ratio | Gross Margin Ratio |
|---|---|---|
| What It Measures | Profitability of each individual sale. | Profitability of the product itself. |
| Costs Included | COGS + all other variable costs (shipping, payment fees, fulfillment, sales commissions). | Only the Cost of Goods Sold (COGS). |
| Primary Use Case | Making pricing, promotion, and marketing spend decisions at a granular level. | High-level assessment of production efficiency and product markup. |
| Strategic Value | Reveals the true cash generated by each sale to cover fixed costs and profit. | Can be misleading for operational decisions as it ignores key sales-related costs. |
Ultimately, contribution margin is about transactional-level truth. It includes those pesky, fluctuating expenses like payment processing fees, shipping, fulfillment center charges, and even sales commissions. It gives you a true profitability pulse right at the point of sale, which is the foundation for any serious product profitability analysis.
For instance, in the dog-eat-dog world of eCommerce, getting this right can be the difference between scaling profitably and lighting money on fire with unprofitable campaigns. One mid-sized DTC apparel brand crunched the numbers on its Meta Ads performance and found its overall CMR was a healthy 42%. This came from $100,000 in sales, minus total variable costs of $58,000 (including $50,000 in COGS, $5,000 in shipping, and $3,000 in commissions), leaving $42,000 as the contribution. For more examples, you can find a great breakdown of the contribution margin formula on brightpearl.com.
Why This Matters for Scaling Your Shopify Brand
Let's make this real. Imagine you run a Shopify apparel store. You launch a new hoodie and it flies off the shelves, quickly becoming your top seller. On paper, its gross margin looks fantastic.
But then you start adding things up. You factor in the bulky shipping costs, the higher-than-average return rates (which is another variable cost!), and the 2.9% Shopify Payments fee on every single transaction. Suddenly, you might discover its contribution margin is razor-thin. Your supposed "winner" could actually be a silent drain on the resources that your more profitable, lighter-weight products are generating.
By tracking the contribution margin ratio, you get the clarity you need for aggressive but smart growth. Think of it as the fuel that powers your business. Knowing exactly how much fuel you get with each sale is the key to winning the long game.
Calculating Your Contribution Margin Ratio Like a Pro
Okay, you get why the contribution margin ratio is so important for your Shopify store. Now, let’s get our hands dirty. While you can start by crunching the numbers in a spreadsheet, that’s a slow, error-prone process that just can’t keep pace with a growing DTC brand. It’s the perfect recipe for making huge decisions based on last month's data.
The real magic happens when you calculate this metric at different levels of your business. This is how you turn a single, high-level number into a sharp, tactical tool. It’s what reveals precisely where your cash is flowing from—and where it’s quietly leaking out. This is where AI-powered analytics simplifies the complexity, replacing manual data crunching with automated clarity.
Think of this as the journey every dollar takes. It shows you exactly what’s left over to fuel the rest of your business after you've paid the direct costs of making a sale.
Start with a Company-Wide Baseline
First things first, you need a benchmark. Calculating your store’s overall contribution margin ratio gives you a single, powerful health score. This 30,000-foot view helps you understand the fundamental profitability of your business model and sets the stage for a much deeper dive.
To get this number, just add up all your revenue and all your variable costs over a set period, like a month or a quarter. The formula is the same: (Total Revenue - Total Variable Costs) / Total Revenue. This gives you that crucial baseline to measure against as you start making changes.
Drill Down to the SKU Level
This is where you find the game-changing insights. Sure, your best-selling t-shirt might have a great gross margin, but what about its high return rate, bulky packaging, and international shipping fees? Calculating the contribution margin ratio for every single SKU unmasks your true profit drivers.
Imagine finding out a less popular, lighter-weight accessory actually has a 65% margin, while that best-selling hoodie only nets you 25%. That insight is pure gold. It tells you exactly which products to push in your next email campaign and which might need a price bump or a new supplier. For a detailed guide on this, check out our article on mastering the contribution margin calculation.
Analyze Your Marketing at the Campaign Level
Are your Meta campaigns actually making you money? A high ROAS can be dangerously misleading if you’re selling products with razor-thin margins. To find out the truth, you have to apply the contribution margin ratio at the campaign level.
This means connecting your ad spend directly to the contribution margin of the products sold through that specific campaign. It answers the ultimate question: after paying for the ads and all the variable costs of the products sold, how much cash did this campaign really put in your pocket?
By linking marketing spend to contribution margin, you move beyond vanity metrics like ROAS and uncover the true profit performance of every ad, ad set, and campaign.
Trying to do this level of analysis manually is nearly impossible. Spreadsheets will break, data lives in different silos, and you ultimately end up guessing. This is exactly the kind of problem AI-powered analytics platforms like MetricMosaic were built to solve.
Instead of wrestling with manual calculations, a tool like this automatically pulls data from Shopify, your ad platforms, and your 3PL to give you real-time profitability insights. You get instant clarity on your most—and least—profitable products and campaigns, letting you make smarter, faster decisions that go straight to your bottom line.
How to Use This Metric for Smarter Growth Decisions
Knowing your numbers is one thing. Using them to outmaneuver the competition is what separates the Shopify brands that scale from the ones that stall out. Your contribution margin ratio isn’t just a health score—it’s a tactical tool for making sharper, more profitable decisions across your entire business.

Let's get past the formulas and into the real-world application. For a DTC founder, this one metric informs the three most critical levers for growth: pricing, promotions, and customer acquisition.
Fine-Tune Your Pricing Strategy
Pricing can feel like more of an art than a science, but your contribution margin ratio grounds that art in cold, hard data. It lets you set prices that don't just cover your product costs, but guarantee a specific amount of cash is generated with every single sale. This shifts the entire conversation from "what will the market bear?" to "what price actually fuels our growth goals?"
Once you have your contribution margin ratio nailed down, you can start optimizing. This is where you can explore different psychological pricing strategies to find that perfect sweet spot between conversion and margin. For instance, a healthy ratio gives you the confidence to test a price increase, knowing exactly how that small bump will impact your bottom line.
Model Promotions with Confidence
Black Friday is looming. Should you run a 25% off sitewide sale? For way too many Shopify brands, the answer is a gut feeling based on what they did last year or what their competitors are doing. That's a recipe for disaster.
A clear grasp of your contribution margin ratio lets you model the financial impact before you ever launch the campaign. You can calculate the precise increase in sales volume needed to make that discount worthwhile.
Let's say your top product has a 50% contribution margin. A 25% discount doesn't just cut your profit; it slashes your margin down to 25%. In a heartbeat, you now need to sell twice as many units just to generate the same amount of contribution dollars as before the sale. Armed with that insight, you might opt for a product bundle or a "buy one, get one 50% off" deal that better protects your profitability.
Connect Contribution Margin to CAC and LTV
This is the holy grail for performance marketers and DTC founders. Your contribution margin is directly tied to your Customer Acquisition Cost (CAC) payback period—the time it takes to earn back the cash you spent to get a customer.
A higher contribution margin means a faster CAC payback. This is the single most important factor in your ability to scale marketing spend aggressively and profitably.
When you generate more cash from each sale, you can reinvest that money into your marketing channels sooner. A brand with a 60% margin can afford to be far more aggressive on Meta or TikTok than a competitor sitting at a 30% margin, even if their AOV is identical. They simply get their money back faster.
Looking at the broader market, data from NYU Stern's 2024 margins dataset shows Retail (Distributors) averaging a CMR proxy of 33.70%. More pointedly, since 2019, DTC brands using platforms like MetricMosaic have pushed their average CMR from 38% to 48%, often driven by cohort analysis that unlocked 15% lifts in retention. If you want to dive deeper into this at the product level, check out our guide on calculating contribution margin in units.
This is where AI-powered analytics becomes a massive competitive advantage. Instead of waiting months to see if a customer cohort becomes profitable, predictive models can use your contribution margin data to forecast LTV and define your ideal CAC. These tools can tell you exactly how much you can afford to spend to acquire the right kind of high-margin customers, turning your profitability data into a clear roadmap for scalable growth.
What’s a Good Contribution Margin Ratio for Shopify Stores?
Every founder eventually asks the same question: "So... are my numbers any good?" When it comes to your contribution margin ratio, the answer isn't some magic number pulled out of a hat. It's more about understanding the lay of the land—industry benchmarks—and then figuring out what your specific business actually needs to win.
For most successful Shopify brands, a healthy contribution margin ratio usually lands somewhere between 40% and 60%. This is generally a solid sweet spot. It means you’re generating enough cash from each sale to cover all your fixed costs (think salaries, rent, and that Shopify plan) while still having enough left over to turn a real profit and reinvest in growth.
Why Benchmarks Change Depending on What You Sell
But here’s the catch: a “good” ratio is completely dependent on your niche. A one-size-fits-all target is a trap because variable costs are wildly different from one eCommerce category to the next.
- Apparel & Fashion: These brands often see a lower contribution margin, maybe in the 35-50% range. This is usually due to higher manufacturing costs (COGS), the headache of return processing, and the fulfillment complexities that come with managing a ton of different SKUs.
- Beauty & Cosmetics: This space is known for much juicier margins, often hitting 55-70% or even higher. Ingredients can have a lower COGS, the products are light to ship, and high perceived value gives brands a lot more pricing power.
- Home Goods & Furniture: This one’s a mixed bag. You might have great margins on small decor items, but big, bulky furniture can get squeezed down to 30-45% once you factor in the brutal costs of freight and specialized shipping.
The point is to use these numbers as a starting point, not a strict rulebook. Your real job is to dial in a target that makes sense for your unique business.
Your Business Model Defines Your "Perfect" Ratio
Think about it: a bootstrapped, two-person startup grinding out of a garage has totally different financial needs than a big, venture-backed brand with a huge team and a fancy downtown office. That VC-backed company needs a much higher contribution margin just to cover its massive fixed costs and keep the lights on.
Your contribution margin ratio isn't just some internal metric to track; it’s a proven predictor of whether an eCommerce business will make it or not. The market is getting smarter, and by 2024, we saw averages start to settle in, with US DTC brands hitting around 40.5% and EU brands at 37.2%. Then you have outliers like Warby Parker, which managed to hit an incredible 62% by taking control of its lens fulfillment, a move that absolutely slashed its variable costs. The lesson? How you run your operations has a direct line to your margin. If you want to see how other companies think about this, Intuit QuickBooks has a solid overview.
The question you should be asking isn't "What's a good contribution margin ratio?" It's "What contribution margin ratio does my business need to hit our growth and profit goals?"
This is exactly where AI-powered analytics platforms like MetricMosaic give you an almost unfair advantage. Instead of getting bogged down in industry reports and guesswork, you get a real-time, automated pulse on your own numbers. We see it all the time with Shopify brands—they come to us averaging around 32% from their spreadsheet days and climb to over 45% after getting set up.
How? It’s all about clarity. When you have instant visibility into your SKU-level and campaign-level profitability, you can stop guessing and start making sharp, data-backed decisions. You can see precisely which products to push, which ads are actually making you money, and where you have wiggle room to adjust your pricing. It’s a shift from chasing generic benchmarks to setting—and hitting—goals that are built for your store's financial reality.
Turn Your Profitability Insights into Action
Knowing your contribution margin ratio is a huge first step, but the real win comes from turning that knowledge into automated, intelligent action. Manually tracking this stuff in spreadsheets is slow, clunky, and way too easy to mess up—it just can't keep up with the speed of DTC eCommerce.
The big takeaway is this: your contribution margin is the key to scaling your brand profitably. Making decisions based on last month's data is like trying to drive forward while staring in the rearview mirror. You need a real-time, forward-looking view of your store's financial pulse.
Moving from Manual Reports to Automated Intelligence
The logical next step is to put your profitability analysis on autopilot. This is where AI and analytics come together to give DTC brands a massive competitive edge. Instead of wrestling with data from ten different places, you can plug into a platform that connects your entire tech stack.
An AI-driven analytics tool like MetricMosaic hooks directly into all your data sources:
- Shopify: For all your order, product, and revenue data.
- Meta & Google: To tie ad spend directly back to profitability.
- Google Analytics: For a complete picture of customer behavior.
- Klaviyo: To see how profitable different customer segments really are.
Unifying all this data allows the platform to hand you critical insights automatically, freeing you from the soul-crushing work of crunching numbers. It replaces guesswork with genuine certainty.
Here’s an example of an AI-generated 'Story' from MetricMosaic that proactively flags a profitability issue before it gets out of hand.
This insight doesn't just show you a bunch of numbers; it instantly tells you which campaign is bleeding money and recommends a specific action. It turns complex data into a clear directive without you having to lift a finger.
From Asking Questions to Getting Answers
Imagine getting a Slack alert the moment a Meta campaign's contribution margin dips below your target. Better yet, picture just asking a question in plain English, like, "What was the contribution margin on our Black Friday sale?" and getting an instant, accurate answer.
This is the power of next-gen, conversational analytics. It changes your relationship with data from a one-way street of pulling reports to a dynamic, two-way conversation that flags opportunities and risks as they happen.
The goal is to stop guessing about your profitability and start acting on it. With real-time visibility, you can finally make confident decisions about pricing, promotions, and ad spend that directly fatten your bottom line.
To really get the most out of this metric, think about enrolling in a dedicated revenue optimization course that can give you advanced strategies for long-term growth. When you combine deep metric knowledge with powerful AI tools, you turn your store's everyday data into your most valuable asset.
Your data is telling a story about the health of your business. The next step is to move from awareness to action.
Contribution Margin Ratio FAQs
Running a Shopify store means you're wearing a dozen different hats. When it comes to your finances, you need straight answers, fast. Here are a few of the most common questions we get from founders about the contribution margin ratio.
How Often Should I Be Looking at This?
For a high-level health check, glancing at this monthly is a decent starting point. It gives you a sense of your profitability trends over time.
But let's be real—in ecommerce, monthly is nowhere near enough when things get serious. During BFCM or a big Meta campaign launch, you need to be watching this like a hawk, ideally in real-time. One bad day running an unprofitable promo can nuke an entire week's worth of profit. This is exactly why automated tools are no longer a "nice-to-have"; they're essential for getting instant alerts the second your margins start to tank.
Is It Possible for My Contribution Margin Ratio to Be Too High?
It sounds weird, but yes, it absolutely can be. While a healthy margin is the goal, an unusually high one—think 85-90%—can signal that your pricing is way off market.
That creates a totally different problem: terrible conversion rates and anemic sales volume. Sure, you're making a killing on every individual sale, but you aren't making enough sales to maximize your total contribution dollars. The objective isn't just a high percentage; it's to find that sweet spot that maximizes both your margin and your sales volume.
A strong contribution margin ratio is a balancing act. It’s about being profitable on each sale while still moving enough product to cover all your fixed costs and actually grow the business. You're aiming to maximize total profit dollars, not just the per-unit percentage.
What Are the Most Common Variable Costs People Forget?
Getting an accurate contribution margin ratio depends entirely on including all your variable costs, not just your cost of goods sold. Too many Shopify brands accidentally inflate their margins by leaving out key expenses that go up with every single order.
Use this checklist to make sure your numbers are rock-solid and you're not missing these commonly overlooked costs:
- Payment Processing Fees: That 2.9% + 30¢ (or whatever your rate is) from Shopify Payments, Stripe, or PayPal that hits every transaction.
- Shipping & Fulfillment Fees: This is more than just the carrier rate. Include your 3PL’s pick-and-pack fees and any shipping insurance.
- Packaging Materials: The actual cost of your branded boxes, mailers, tape, and any cool inserts you include.
- Sales Commissions & Affiliate Payouts: Any percentage you pay out to partners or affiliates for sending a sale your way.
- Transaction-Based App Fees: Those pesky fees from apps that take a small percentage or a flat fee for every order they touch.
- Customer Support Costs: If you use a service that charges per ticket or interaction, you can often treat this as a variable cost.
Ready to stop guessing and start knowing your true profitability? MetricMosaic connects directly to your Shopify store and marketing channels, giving you an automated, real-time view of your contribution margin—from your entire business down to a single SKU or ad campaign. Start your free trial today.