Unlocking True Profit: A Guide to Product Profitability Analysis for Shopify Brands
Struggling with unclear margins? This guide to product profitability analysis helps Shopify DTC brands identify their most profitable items and boost growth.
You know the feeling. Your Shopify dashboard shows revenue is climbing, and one of your products is flying off the digital shelves. On paper, it looks like you're crushing it. But when you check your bank account, the numbers just don't add up. Where is the cash going?
This disconnect is a classic challenge for growing DTC brands, and it's almost always a sign that hidden costs are silently eating your profits. That "bestseller" might actually be your biggest money pit, thanks to high ad spend, complex fulfillment, or a painful return rate.
This is precisely why product profitability analysis isn't a "nice-to-have" for Shopify stores—it's your most essential tool for survival and growth. It's about figuring out the true net profit on every single product you sell, after every single cost is accounted for. It's how you turn confusing, fragmented data into a clear roadmap for scalable growth.

Why Your Bestseller Could Be a Financial Black Hole
It’s a story we see constantly with ambitious DTC founders. A hero product drives record sales, but the bottom line stays stubbornly flat. The reason? True profit is so much more than just revenue minus the cost of the product (COGS). The real calculation includes every single expense tied to getting that product into a customer's hands.
Without a complete, SKU-level view, you’re flying blind and making critical decisions with half the information.
Beyond Surface-Level Metrics
To get the full picture, you have to track everything:
- Variable Costs: Shipping fees, payment processing charges, packaging materials, and pick-and-pack labor.
- Marketing Spend: The specific ad dollars from Meta, Google, or TikTok that can be attributed to each sale.
- Returns and Refunds: The costs of return labels, restocking, and lost revenue.
- Overhead Allocation: A fair slice of your fixed costs, like your Shopify subscription, app fees, and salaries.
Manually pulling this data from Shopify, your ad platforms, and your 3PL reports is a recipe for disaster. It's not just a massive time-suck; it's riddled with errors that lead to flawed insights and bad decisions.
The AI-Powered Analytics Advantage
This is where next-generation analytics platforms turn complexity into clarity. Instead of fighting with messy spreadsheets, an AI-driven tool like MetricMosaic automates the entire process. It plugs into all your data sources—Shopify, Klaviyo, Meta, Google—and unifies everything into a single source of truth.
In seconds, you get a real-time, SKU-level P&L. You can instantly see which products are your genuine profit engines and which are just "vanity bestsellers"—high on revenue but low (or even negative) on actual profit. This is the power of story-driven data: it moves you from what happened to why it happened, giving you the confidence to build a more resilient and scalable DTC brand.
What Are Your Products Really Costing You?
If you want to build a truly profitable Shopify brand, you have to know your numbers inside and out. No shortcuts, no guesswork. Most stores have a decent handle on their Cost of Goods Sold (COGS), but that’s just the tip of the iceberg. A real product profitability analysis means digging deeper to uncover all the "in-between" costs that quietly erode your margins.
Think of it this way: COGS is the main ingredient. But to understand the final result—your actual profit—you have to account for every little thing you add. Miss just one, and you're making decisions based on bad math.
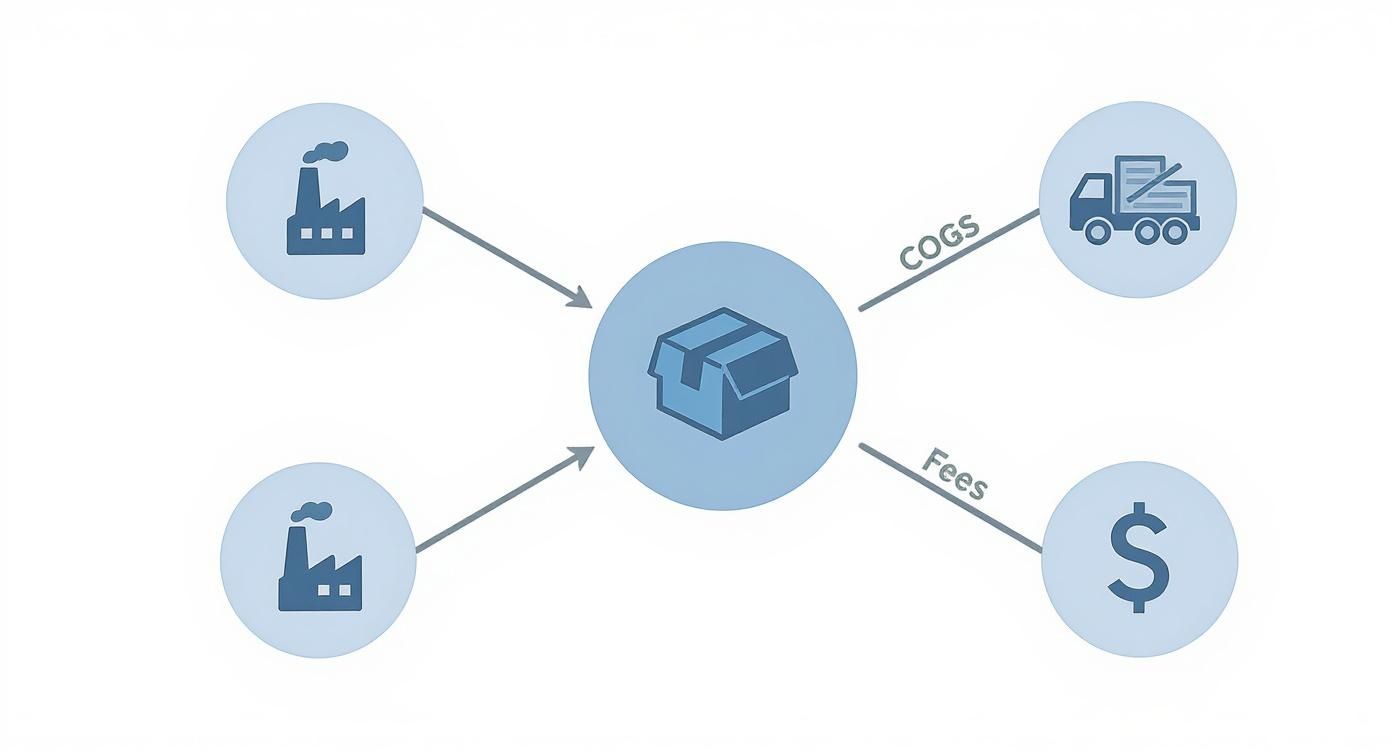
It's So Much More Than COGS
Your landed cost is just the starting line. True analysis tracks every expense from the moment a customer clicks "buy" to the second the package lands on their doorstep—and even after. These costs get lost in a high-level P&L but are critical for knowing if a SKU is actually making you money.
We’re talking about a whole list of variable costs that change with every order:
- Payment Processing Fees: Whether it's Shopify Payments or another gateway, every transaction has a fee. Those small percentages add up fast.
- Shipping & Fulfillment: This isn't just the carrier rate. It's the boxes, mailers, tape, and the labor your team or 3PL spends picking and packing.
- Return Handling: A return isn’t just lost revenue; it’s a cost center. You pay for the return label, the labor to inspect and restock the item, and sometimes you’re left with inventory you can’t resell.
- Custom Packaging: Those beautiful branded boxes and custom tissue paper create a great unboxing experience, but they add a very real cost to every order.
A product might look like a winner on a spreadsheet that only includes COGS, but in reality, it could be a silent killer bleeding you dry once fulfillment and transaction fees are baked in. This is the complexity AI-powered analytics are designed to solve automatically.
Reading the Broader Economic Tea Leaves
It’s also smart to see how the broader economy impacts your costs. For example, a recent latest BEA report on corporate profits showed that while GDP grew, corporate profits barely moved. This suggests that while sales are up, rising costs are squeezing margins across the board. This is the exact pressure that makes SKU-level profitability so critical for DTC brands trying to stay ahead.
Your All-In Cost Checklist
To get this right, you need a comprehensive list. Manually pulling this data together is a soul-crushing task—which is why AI-powered tools automate it. Here’s every cost you need to track for each product:
- Cost of Goods Sold (COGS): The baseline cost from your manufacturer.
- Inbound Shipping & Duties: What it costs to get inventory to your warehouse.
- Fulfillment Costs: All pick-and-pack fees from your 3PL or in-house team.
- Packaging Materials: The per-unit cost of boxes, mailers, tape, and inserts.
- Outbound Shipping: The actual price you pay the carrier.
- Transaction Fees: The percentage skimmed by your payment processor.
- Return Costs: Every expense tied to processing a return for that SKU.
Once you can confidently assign every one of these costs, you’re no longer guessing. You have a precise, product-level P&L. That clarity is the first step toward making smarter decisions that actually grow your Shopify brand.
How to Accurately Allocate Shared Costs like Marketing & Overhead
You’ve nailed down your variable costs. Now comes the part where most Shopify brands get stuck: fairly assigning shared expenses like marketing spend and operational overhead.
Think of your business as a pizza. It’s easy to know the cost of the pepperoni on one slice (your product's COGS), but how do you account for the cost of the oven that baked the whole pie? This is the core challenge of cost allocation, and getting it right is the key to an accurate profitability analysis.
Decoding Your Marketing Spend
Your marketing budget is one of the biggest and most complex shared costs. Spreading your total Meta ads spend evenly across all products is a recipe for disaster. A product that gets most of its sales from organic search shouldn't carry the same ad burden as one you're pushing heavily with paid campaigns. This is where you need to get a handle on Customer Acquisition Cost (CAC) at a product level.
- First-Touch & Last-Touch Attribution: These are simple models but often misleading. They give 100% of the credit for a sale to a single touchpoint, ignoring the rest of the customer’s journey.
- Multi-Touch Attribution: This is the most accurate approach. It distributes credit across multiple touchpoints—the Facebook ad they saw, the Google Shopping link they clicked, and the email they opened before buying.
Manually building a multi-touch attribution model is nearly impossible for a busy founder. It requires stitching together fragmented data from every platform. This is where AI-driven analytics platforms like MetricMosaic become a game-changer, automating this complexity to deliver a clear, channel-specific CAC for each product sale.
Distributing Operational Overhead
Next up are fixed overheads—the costs of keeping the lights on. These are expenses like your rent, salaries, and monthly software subscriptions like Shopify Plus and Klaviyo.
The most straightforward way to allocate these is based on each product’s share of total revenue. For example, if your "Performance Hoodie" drove 30% of your total revenue last month, you would allocate 30% of your total overhead costs to that product. This method ensures your bestsellers carry a proportional share of the operational burden.
By combining direct costs, allocated marketing spend, and a proportional share of overhead, you finally arrive at a fully loaded profit margin. This dynamic, real-time view of profitability—by SKU, channel, and even customer cohort—moves you from simply tracking sales to truly understanding the financial engine of your DTC business. It’s the foundation for making smarter, more profitable decisions.
Putting Your Profitability Analysis Into Action

Theory is great, but let's get practical. This is where the rubber meets the road for your Shopify brand. We’re going to walk through a real product profitability analysis to see how it can show you which products are your cash cows and which are secretly draining your bank account.
Let’s say your DTC brand sells 'The Performance Hoodie'. It’s a bestseller, but you have that nagging feeling it isn’t the goldmine you thought. To find the truth, you need a clean, SKU-level Profit and Loss (P&L) statement.
Building the SKU-Level P&L
We'll start with the sale price and then subtract every single cost until we find the true net profit. Here’s the math for one 'Performance Hoodie' that sells for $90:
- Revenue: $90.00
- Subtract Landed COGS: -$30.00 (Factory cost + inbound shipping/duties)
- Subtract Fulfillment & Shipping: -$12.00 (Pick/pack fees, box, shipping label)
- Subtract Transaction Fees: -$2.91 (Standard Shopify Payments fee)
- Subtract Attributed Marketing Spend: -$15.00 (Average ad cost to sell one hoodie)
After these direct costs, you're left with a contribution margin of $30.09. But we’re not done. You still have to account for returns and overhead to find the real net profit.
The Power of Analyzing Profit by Channel
This is where your analysis becomes a superpower. The profitability of the exact same hoodie can change dramatically depending on how the customer found you. Let's compare a sale from a Facebook Ad with one from Google Shopping.
| Metric | Facebook Ads Customer | Google Shopping Customer |
|---|---|---|
| Revenue | $90.00 | $90.00 |
| Landed COGS | -$30.00 | -$30.00 |
| Fulfillment & Shipping | -$12.00 | -$12.00 |
| Transaction Fees | -$2.91 | -$2.91 |
| Attributed Marketing CAC | -$22.00 | -$11.00 |
| Contribution Margin | $23.09 | $34.09 |
Boom. The insight is immediate and actionable. The hoodie is nearly 50% more profitable when a customer comes from Google Shopping because the Customer Acquisition Cost (CAC) is half of what it is on Facebook. This tells you exactly where to invest your marketing budget for maximum profit.
This is the kind of clarity a tool like MetricMosaic provides automatically, turning complex data into a simple story. Instead of just seeing revenue, you see the fully loaded net profit per SKU at a glance.
The core of effective product profitability analysis is balancing price, sales volume, and product mix. Smart adjustments to these levers directly impact your bottom line.
This focus is going mainstream. A 2025 Deloitte consumer products industry outlook found that top companies are increasingly focused on "price-pack architecture"—a clear signal that the smartest brands are getting surgical with their pricing to maximize profit.
By applying this same logic to customer segments (new vs. returning), you can uncover even deeper insights. An automated analytics platform does the heavy lifting, connecting the dots between sales data, fulfillment costs, and ad spend to give you the clarity you need to make smarter, more profitable decisions.
Where Profitability Analysis Goes Wrong (And How to Fix It)
Even the sharpest DTC founders can get tripped up by a few common mistakes in their profitability analysis. You're busy, you're moving fast, and suddenly you’re making big decisions based on bad numbers—scaling a product that’s secretly bleeding cash or cutting a winner just before it takes off.
Think of it like navigating a minefield. The first step is knowing where the traps are buried. Let’s walk through the big ones so your numbers always tell you the truth.
1. Relying on Stale, Siloed Data
This is the biggest trap. You're making decisions today based on last month's data pulled into a spreadsheet. But your shipping rates, ad costs, and COGS can shift in days. A hero product from Q1 could be a dud today. Manual data crunching is a surefire way to operate in the past.
The Fix: You need a single source of truth. Instead of patching together reports, an AI-powered platform like MetricMosaic plugs directly into your Shopify store, ad accounts, and 3PL. It automates data collection, so your analysis is always running on live, accurate information.
2. Ignoring the Real Cost of a Return
Most brands see returns as just lost revenue, but the financial hit is much deeper. Every return kicks off a chain reaction of hidden costs:
- Return Shipping Labels: The cost to get the product back.
- Labor Costs: The time your team spends unpacking, inspecting, and restocking.
- Inventory Write-Offs: The money lost on items that come back damaged.
When you don't track these costs back to the specific SKU, you’re pretending products with high return rates are more profitable than they really are. A proper analysis connects these expenses back to the source, revealing which items are secretly eating your margin.
3. Using Blended Marketing Averages
This is another classic mistake: applying one blended Customer Acquisition Cost (CAC) across your entire product catalog. It hides the truth. As we saw earlier, the same product can have a wildly different profit margin depending on whether a customer came from an expensive Meta ad or free organic search.
This problem exists at every scale. The global Automobile Manufacturing industry, valued at $2.876 trillion, lives and dies by granular cost analysis. While your DTC brand operates differently, the principle is identical: averaged costs are misleading. You can see how critical this is in the full industry breakdown.
The Fix: Use an attribution model that ties ad spend directly to specific SKUs and channels. This gives you a true, channel-specific CAC for every product, letting you allocate your marketing budget with surgical precision. Steer clear of these common errors, and your profitability analysis will become your most powerful tool for growth.
Turning Profit Insights Into Actionable Growth

Running a product profitability analysis is like getting a physical for your Shopify store. It shows you what's healthy and what needs attention. But the diagnosis is only half the battle. The real value comes from turning those insights into smart, decisive moves that build a stronger business.
Once you have a crystal-clear picture of your profit winners and losers, it's time to build a growth strategy around that reality. This is where you graduate from just knowing the numbers to making them work for you.
Reallocate Your Marketing Spend for Maximum Profit
This is one of the fastest ways to see an impact. When you know your exact profit-per-SKU on every channel, you can stop guessing and start investing with confidence.
- Fund Your Winners: Shift more ad budget to the channels that deliver high-LTV customers for your most profitable products. If Google Shopping brings in a $34 contribution margin per sale versus $23 on Meta, the next move is clear.
- Fix or Cut Your Losers: For products that are bleeding money on certain channels, you have a choice: optimize the campaigns or simply pull the plug and reallocate that spend to what's working.
Optimize Your Product and Pricing Strategy
Your profitability data is a goldmine for refining your product catalog and pricing. It gives you the hard evidence you need to make tough but essential decisions.
Actionable data transforms you from a reactive store owner into a proactive growth strategist. It allows you to build a business where every product and campaign is intentionally designed to drive profit.
Here are a few strategic adjustments driven by data:
- Bundle High-Margin Items: Pair a profitable hero product with a slower-moving item to create a compelling bundle. This is a classic tactic to boost Average Order Value (AOV) and move more inventory.
- Adjust Pricing with Confidence: If a product's true costs are higher than you realized, you now have the data to justify a price increase. Conversely, you might find a high-margin hero where a small price drop could massively increase sales volume and overall profit.
- Delist or Redesign Unprofitable SKUs: Sometimes, the smartest move is to let a product go. If a SKU is consistently losing money, it’s a drain on your resources. Delisting it can be one of the most profitable decisions you'll ever make.
This isn't a one-time fix. It’s about creating a continuous feedback loop: analyze, act, measure, and refine. That’s how you turn data into a real competitive advantage.
Quick Q&A for Shopify Founders
Jumping from tracking top-line revenue to digging into product profitability analysis can feel like a big leap. It's normal to have questions as you peel back the layers on your numbers. Here are straightforward answers to the questions we hear most from DTC founders.
How often should I run this analysis?
While a major strategic review might happen quarterly, for a fast-moving DTC brand, you need to look at your profitability at least weekly. Ad performance, shipping rates, and customer trends change too quickly to wait a month. The ultimate goal is to shift from static reports to a live pulse on your numbers. Next-gen tools like conversational analytics are making this even easier, allowing you to simply ask questions about your data and get instant answers.
What's the difference between Gross Profit and Contribution Margin?
Getting this right is crucial.
- Gross Profit is simple: Revenue minus Cost of Goods Sold (COGS). It tells you what you made on the physical product itself.
- Contribution Margin is more powerful. It’s your Revenue minus all variable costs (COGS, shipping, transaction fees, packaging). It shows you how much cash each sale "contributes" to paying for your fixed costs like rent and salaries, giving you a much clearer picture of profitability.
Can't I just do this in a spreadsheet?
You could try, but for any growing Shopify brand, spreadsheets quickly become a liability. You’d spend hours manually pulling and cleaning data from Shopify, Google Ads, Facebook, and your shipping provider. It’s not just a time sink; it’s a minefield for human error. One wrong formula and you could make a five-figure decision on bad data. An AI-powered analytics platform automates this, piping all your data into one place for a real-time, trustworthy view of your business. It saves you the headache and gives you numbers you can actually bet on.
Ready to stop guessing and start knowing your true profitability? MetricMosaic connects to your Shopify store and marketing channels in minutes, automatically building a real-time, SKU-level P&L for your entire business. Start your free trial today.