How to Use a Customer Acquisition Cost Calculator to Grow Your Shopify Store
Use our customer acquisition cost calculator guide to accurately measure marketing ROI, forecast growth, and reduce CAC for your Shopify store.

Ever get that nagging feeling when your Meta Ads dashboard is screaming success, but your Shopify P&L is telling a completely different story? It’s a common frustration for DTC founders. You’re not imagining things.
Trying to stitch together reports from Shopify, Google Analytics, and all your ad platforms feels like flying blind. It’s a constant battle to answer one simple, but absolutely critical, question: what does it really cost us to get a new customer?
This fragmented data isn't just an annoyance—it's a direct threat to your growth. Without a clear view of your Customer Acquisition Cost (CAC), you can’t make smart decisions about where to invest your next marketing dollar.
Why Your Shopify Reports Are Lying About New Customers
For way too many DTC founders, the daily grind involves a messy tangle of spreadsheets and a dozen open browser tabs. You grab ad spend from Meta, creative costs from an invoice, and new customer counts from Shopify, hoping it all adds up.
The result is almost always a murky, inaccurate picture of your Customer Acquisition Cost (CAC). And this isn't just a reporting headache; it's a massive strategic blind spot.
When you can't trust your numbers, you start making decisions on gut feelings instead of data. You might pour money into an ad campaign that feels like a winner, only to find out months later it was just attracting low-value, one-time buyers. Or worse, you cut spend on a channel with a higher initial CAC, not realizing it's your primary source of customers with incredible lifetime value.
This is the central challenge for growing Shopify brands. Your standard tools give you pieces of the puzzle, but they never show you the complete picture. They don't account for all your costs, and they definitely don't connect the dots between your acquisition efforts and long-term profitability.
The Real Cost of Fragmented Data
Relying on these disjointed reports creates some serious risks that can bring your growth to a screeching halt. Here are the most common problems we see:
- Inaccurate Profitability: You might think a product line is a home run, but if its true acquisition costs are buried or misattributed, you could actually be losing money on every single sale.
- Wasted Ad Spend: Without a crystal-clear, channel-specific CAC, you're almost certainly burning cash on campaigns that aren't delivering a positive return.
- Poor Strategic Decisions: Should you invest more in influencer marketing or Google Ads? Without a reliable CAC for each, you're just guessing. It's a coin flip, not a calculated move.
This is where a proper customer acquisition cost calculator becomes more than just a tool—it's your first step toward clarity. It’s the foundational metric that helps you replace guesswork with confidence, turning the complexity of your store data into a powerful competitive advantage.
Ultimately, getting a true handle on your CAC is about taking control of your brand's financial health. It’s about drawing a straight line from your marketing spend to your bottom line.
In an increasingly competitive DTC world, the brands that master this metric are the ones that win. This guide will show you how to move from data confusion to decisive action, starting with building a CAC calculation you can actually trust.
How To Calculate Your Baseline Customer Acquisition Cost
Let's get straight to it. Figuring out your baseline Customer Acquisition Cost (CAC) isn’t some dark art of financial modeling; it’s about getting crystal clear on your business's health. The whole point is to land on one simple number: how much, on average, are you really spending to get one brand-new customer through the door?
The basic formula is as straightforward as it gets:
CAC = Total Marketing & Sales Costs / Number of New Customers Acquired
You'll want to calculate this over a specific period—most brands do it monthly or quarterly. The real trick, and where so many DTC founders get tripped up, is in honestly defining "Total Marketing & Sales Costs." Trust me, it’s a lot more than just your Meta ad spend.
Uncovering Your True Acquisition Costs
To get a real, trustworthy baseline CAC, you need to pull together every single dollar related to winning new customers. This means digging way deeper than your ad platform dashboards.
Here’s a simple rule of thumb: if a cost would disappear if you completely stopped all new customer acquisition efforts, it probably belongs in your CAC calculation.
Before you start crunching numbers, you need to gather the right inputs. These are the costs that often get overlooked but are crucial for an accurate picture.
Essential Inputs for Your CAC Calculation
This table breaks down the common marketing and sales expenses you'll need to include for an accurate CAC figure.
| Cost Category | Description | Example (for a monthly calculation) |
|---|---|---|
| Ad Spend | The most obvious one. This is all your paid media spending across platforms like Meta, Google, TikTok, and Pinterest. | $15,000 |
| Salaries | A portion of the salaries for your marketing team. If a manager spends 75% of their time on acquisition, include 75% of their salary. | $5,000 |
| Agency & Freelancer Fees | Money paid to marketing agencies, content creators, copywriters, or SEO consultants focused on acquisition. | $3,000 |
| Software & Tools | Subscriptions for your marketing stack—email platforms like Klaviyo, analytics tools, SEO software, etc. | $500 |
| Creative Costs | Expenses for photoshoots, video production, and graphic design for your ads and campaigns. | $1,000 |
Compiling this list is often an eye-opening experience. It forces you to see just how fragmented your data really is, which is a massive headache for most founders.
This journey from staring at a dozen different reports to having a single, clear view is something we see all the time.
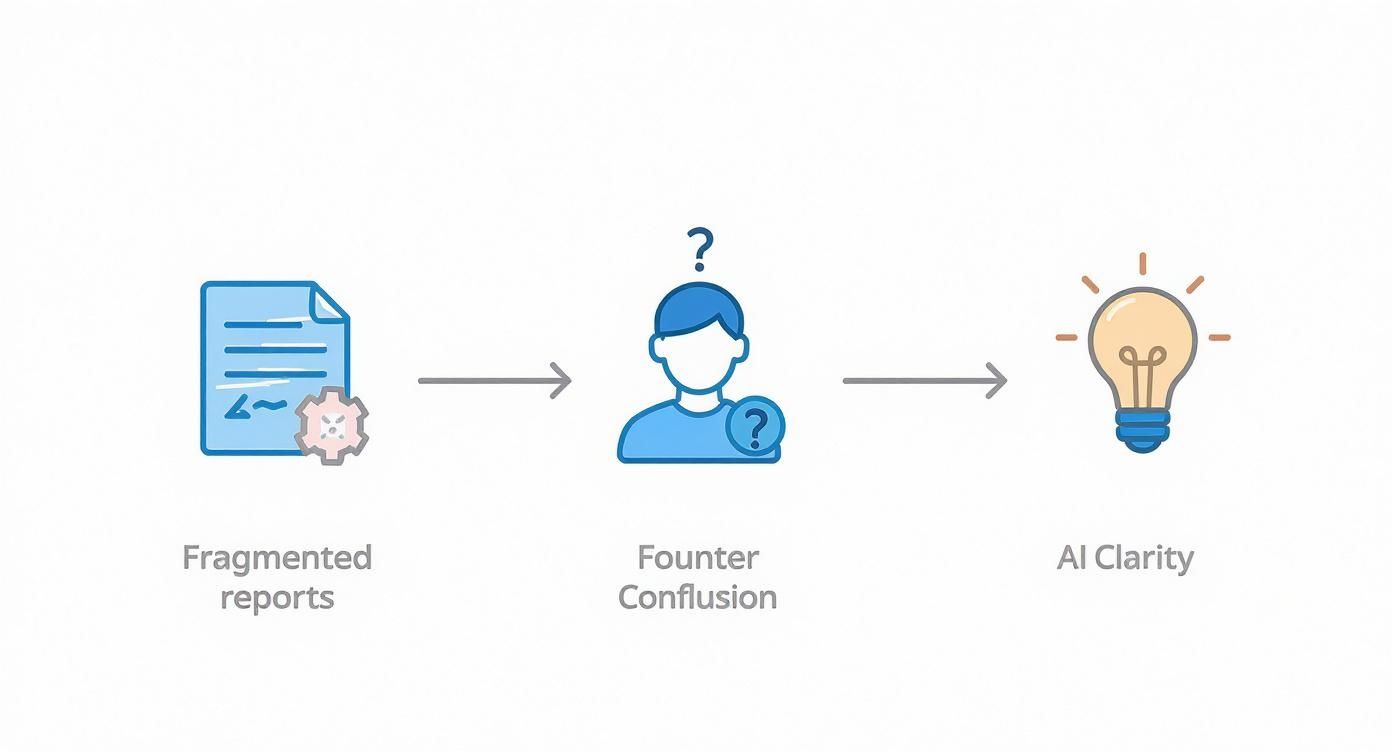
This is why moving past manual data-pulling is so important. AI-powered analytics replaces this manual crunching, creating a unified, intelligent view of your data that is the only way to make sense of crucial metrics like CAC.
A Real-World DTC Example
Let’s walk through a realistic scenario. Imagine a growing Shopify skincare brand looking at their performance over Q1 (a three-month period).
During that quarter, they spent a grand total of $40,000 on all marketing and sales activities. In that same time, they brought in 160 brand-new customers.
Plugging that into the formula gives them a CAC of $250 per customer ($40,000 / 160).
That single number is incredibly powerful. It’s their baseline. It’s the stake in the ground they can use to measure marketing efficiency and decide if their growth strategy is actually sustainable.
So, how did they get to that $40,000 total cost? It wasn't just ad spend.
- Meta & Google Ads: $25,000
- Marketing Team Salaries (Acquisition Portion): $10,000
- Influencer Marketing Fees: $3,000
- Software Subscriptions (Analytics, Email, etc.): $1,000
- Creative Asset Production: $1,000
By tallying everything up, the founder gets a true, "fully loaded" picture of their spending—no vanity metrics, just reality.
Founder-Friendly Takeaway: Calculating your baseline CAC isn't just an accounting chore. It's about establishing a single source of truth for your growth engine. It's the number that tells you if your marketing dollars are actually building a profitable business or just lighting cash on fire.
Once you have this baseline, the real work begins. Start tracking it month-over-month. Is it going up? Down? That simple trend line is one of the most vital signs of your DTC brand's health.
But here’s the thing: as important as this baseline number is, it also hides some dangerous truths. A single, blended CAC for your entire store can be incredibly misleading. For now, your priority is to move beyond surface-level ad metrics and calculate a number you can genuinely trust. This is your starting line.
Why A Simple CAC Formula Can Be Misleading

Figuring out that single, store-wide CAC is a fantastic start. Seriously. You’ve officially moved from gut feelings to data, which already puts you ahead of a lot of other Shopify stores.
But relying on this one "blended" number is like looking at your Shopify store's total revenue without ever checking which products are actually selling. It tells you something, but it hides all the important details.
A blended CAC averages out the performance of all your marketing channels into one tidy figure. It’s convenient, but it can be dangerously misleading for a growing brand. It can easily mask critical problems, making you think your marketing is healthier than it really is.
The truth is, not all customers cost the same to acquire, and they definitely don't all bring the same value. A single number just can't capture that reality.
The Blended CAC Trap: A Real-World Scenario
Let's imagine your Shopify skincare brand has a blended CAC of $50, which feels pretty good. Your Average Order Value (AOV) is $75, so on the surface, you're profitable on that first purchase. Time to crank up the ad spend, right?
Not so fast.
When you dig just one level deeper, the story changes completely. A granular, channel-specific analysis shows what's really going on:
- Google Ads: You spent $10,000 and got 400 new customers. Your channel CAC here is a fantastic $25.
- Meta Ads: You spent $10,000 and got only 100 new customers. Your CAC on this channel is a staggering $100.
Suddenly, your "healthy" $50 blended CAC feels like a lie. In reality, Google Ads is your growth engine, delivering profitable customers with every click. Meanwhile, your Meta campaigns are actively losing money on every single acquisition.
Without breaking this down, you'd keep pouring cash into an unprofitable fire, completely unaware. This is the blended CAC trap. One highly profitable channel props up the average, making your overall performance look solid while other channels bleed your budget dry.
Beyond Channels: Getting Smarter with Cohort Analysis
The next level of analysis is looking at your CAC through the lens of customer cohorts. A cohort is just a group of customers acquired during the same time (like "January 2024 Buyers") or from the same campaign (like your "Black Friday Sale Cohort").
Analyzing CAC by cohort helps you understand the long-term value of the customers you're acquiring. For instance, you might discover that customers from influencer marketing have a higher initial CAC of $70, but their lifetime value (LTV) is 3x higher than customers from other channels. They buy more often and stick around longer.
That insight is pure gold. It tells you that paying a higher upfront cost for these specific customers is a brilliant long-term investment. A simple blended CAC would never reveal this kind of story.
This is where the manual work in spreadsheets starts to break down, and it's where AI-powered analytics platforms like MetricMosaic become a game-changer. They automate the entire process, connecting data from Shopify, your ad platforms, and analytics tools into one place.
Instead of wrestling with VLOOKUPs for hours, you get instant clarity. The AI does the heavy lifting, surfacing the story hidden in your data. It doesn't just give you a number; it tells you why that number matters and what to do about it. It might flag that your Meta CAC is trending up while identifying a new, high-value customer segment emerging from your TikTok campaigns.
This is how you move from just reporting numbers to making truly intelligent growth decisions.
Turning Your CAC Into Actionable Growth Insights
Figuring out your CAC is a huge win, but that number is really just the beginning of the story. A $50 CAC could be a home run for one Shopify store and an absolute disaster for another. The real magic happens when you give that number some context—turning it from a lonely metric into a powerful indicator of your business's health and potential.
To get there, we need to compare your CAC against two other crucial numbers: Lifetime Value (LTV) and your CAC Payback Period. This is how you stop just knowing your cost and start understanding your profitability and how much room you have to grow.
The Golden Ratio: LTV to CAC
Lifetime Value (LTV) is the total profit you expect to make from a single customer over their entire relationship with your brand. Think of it as the long-term worth of each person you bring in the door.
When you compare LTV to CAC, you get a brutally honest answer to the question: is my acquisition strategy actually sustainable? For every dollar I spend to get a customer, how many am I getting back over time?
The gold standard for a healthy, growing DTC brand is an LTV to CAC ratio of 3:1 or higher.
- A 3:1 ratio is the sweet spot. It means for every $1 you spend on ads and marketing, you’re getting $3 back in lifetime profit. This is where sustainable, profitable growth lives.
- A 1:1 ratio means you’re just treading water. You're swapping one dollar for another, leaving no room for profit. It’s not a viable long-term plan.
- A 5:1 ratio or higher might look amazing on the surface, but it can actually be a red flag. It often means you're underinvesting in marketing and leaving a ton of growth on the table.
Understanding this ratio is non-negotiable for any Shopify founder. It's the clearest indicator of whether your business model is working. A healthy ratio gives you the confidence to scale your ad spend, knowing that each new customer is a profitable long-term investment.
CAC Payback Period: Your Cash Flow Thermometer
While LTV gives you the long-term profitability picture, your CAC Payback Period is all about short-term survival. It answers a simple, but vital, question: How many months does it take to earn back the cash we spent to acquire a new customer?
This is absolutely critical for bootstrapped or early-stage brands where cash is king. A short payback period means your marketing dollars get recycled quickly, freeing up capital to reinvest in more growth. A long payback period, on the other hand, can put a serious strain on your finances—even if your LTV to CAC ratio looks great on paper.
For most brands, you want to see a CAC Payback Period of under 12 months. If you have high-margin products or fantastic repeat purchase rates, aiming for 6 months or less is even better.
What Does a Good CAC Look Like in eCommerce?
It's tempting to hunt for a single "good" CAC number, but the truth is, it's all over the map. The number that works depends entirely on your industry, competition, average order value, and how often customers come back to buy again.
The market has definitely gotten tougher. The global average CAC in eCommerce has exploded—what was around $9 back in 2013 has ballooned by over 222% to about $29 today. Some recent Shopify reports even place the figure in the $68 to $78 range. You can dive deeper into these eCommerce CAC trends on loyaltylion.com.
This surge just shows how competitive the DTC space has become. To give you a better sense of where you might stand, here’s a look at how benchmarks can differ across popular sectors.
eCommerce CAC Benchmarks by Industry
The cost to acquire a customer varies significantly depending on the products you sell and the market you're in. The table below offers a general comparison of average CACs across a few key direct-to-consumer industries.
| Industry | Average CAC (Approx.) | Key Acquisition Drivers |
|---|---|---|
| Beauty & Cosmetics | $40 - $80 | Influencer marketing, subscriptions, high LTV |
| Fashion & Apparel | $25 - $60 | Trend-driven, strong social proof, return rates |
| Home Goods | $70 - $150 | Higher AOV, less frequent purchases |
| Consumer Electronics | $100 - $250+ | High-ticket items, extensive research phase |
Don't treat these as gospel, but use them as a directional guide. Your real goal isn't to perfectly match some industry average; it's to build a profitable LTV to CAC ratio and a sustainable payback period for your business. That's the only benchmark that truly matters for scaling your store.
Ditch the Spreadsheets: Automating Your Shopify CAC with AI
Let's be honest. Manually calculating, tracking, and trying to make sense of your CAC is a brutal, time-consuming grind. For any Shopify founder wearing multiple hats, it’s a total nightmare of exporting CSVs, wrestling with spreadsheets, and constantly second-guessing if you've remembered every single cost.
It’s slow, it’s prone to human error, and by the time you actually have an answer, the data is already old news. This is where the entire process gets a much-needed upgrade.
Modern AI analytics tools were built to eliminate this exact pain point. They’re designed to transform all your scattered data into a single, reliable source of truth. The goal isn't just to calculate CAC faster; it's to turn that metric into a proactive tool for real growth.
From Manual Data Crunching to Automated Clarity
An AI-powered analytics platform like MetricMosaic connects directly to all your essential data sources. It plugs right into your Shopify store, Google Analytics, and ad platforms like Meta and Google Ads, automatically pulling everything together in real time.
This direct integration is the foundation for effortless and accurate analysis. Instead of you hunting down the numbers, the AI does the heavy lifting. It ensures every dollar of ad spend, every new customer, and every related cost is accounted for. The result is a fully-loaded, always-on customer acquisition cost calculator you can actually trust.
Uncovering the Story Behind the Numbers
But the real power of AI here goes way beyond just doing the math. It’s about surfacing the actionable insights—the "so what"—hidden deep inside your data. A good AI co-pilot doesn't just hand you a number; it tells you a story about your business.
For instance, it can automatically segment your CAC to reveal what’s really driving performance:
- Channel-Level Insights: Instantly see which channels (Meta, Google, TikTok) are acquiring your most profitable customers, not just the cheapest ones.
- Campaign-Specific Performance: Pinpoint exactly which ad campaigns are delivering a positive ROI and which ones are just burning cash.
- Product-Level Profitability: Discover which of your products attract high-value customers, helping you sharpen your marketing focus.
Customer acquisition costs can vary wildly, not just by industry, but by the very channels you use. You might find that social media advertising brings in customers for $120 each, while your SEO efforts land new buyers for just $100. Knowing these differences is crucial for smart budget allocation, and you can dig deeper into these cost differences across marketing channels on gocustomer.ai.
Predictive Insights and Conversational Analytics
This is where things get really interesting. Instead of just looking backward at historical data, AI tools can give you predictive insights that help you make smarter decisions about the future.
An AI-powered platform can forecast the future LTV of newly acquired customer cohorts, helping you decide which acquisition channels are worth scaling. It can identify customers at risk of churning and suggest retention strategies before they leave.
On top of that, the rise of conversational analytics completely changes how you interact with your data. Imagine just asking questions in plain English, like you’re talking to a growth strategist on your team.
You could ask things like:
- "What was our CAC for first-time buyers from the holiday campaign?"
- "Show me the LTV to CAC ratio for customers acquired through our influencer program."
- "Which ad creative is driving the lowest CAC this month?"
This capability demolishes the technical barriers, allowing anyone—from the founder to a marketer—to get immediate answers and make data-driven decisions on the fly. It transforms analytics from a complex, intimidating task into a simple conversation. By automating the calculations and surfacing story-driven insights, AI empowers you to stop managing spreadsheets and start actively reducing your CAC and growing your bottom line.
Your Top Shopify CAC Questions, Answered
As a founder, you're always on the lookout for an edge. Getting a real handle on your Customer Acquisition Cost is one of the biggest levers you can pull for profitable growth. Here are the answers to the questions we hear most often from founders in the trenches.
What’s a Good LTV to CAC Ratio for a Shopify Store?
For a growing Shopify store, a healthy LTV to CAC ratio is 3:1 or higher. Think of it this way: for every dollar you put into acquiring a customer, you should be getting at least three dollars back over their lifetime. It’s a solid benchmark for sustainable growth.
If your ratio is dipping below 3:1, it might be a red flag. You could be overspending on ads, or maybe you have a retention issue that needs attention. On the other hand, if you're seeing a crazy high ratio like 5:1 or 6:1, you might actually be underinvesting in marketing and leaving money on the table. It's all about finding that sweet spot.
How Often Should I Be Calculating My CAC?
You’ll want to look at your blended, store-wide CAC every month to keep an eye on the big picture. But for the numbers that really matter—your channel-specific and campaign-level CAC—you need to be checking in weekly, if not daily. This is especially true when you're spending big.
Trying to do this by hand is a nightmare for a busy founder. It's just not realistic. That's where a good analytics platform comes in, giving you a real-time pulse on your CAC. You can spot a bleeding campaign and shift budget long before you burn through too much cash.
Founder Takeaway: Running your business on monthly reports is like trying to drive by only looking in the rearview mirror. You need automated, real-time CAC tracking to make the quick, agile decisions that protect your profitability today, not next quarter.
What Are the Most Common Mistakes When Calculating CAC?
We see two big mistakes all the time: 1) not including all the real costs, and 2) only ever looking at a blended CAC. It’s so easy to just count ad spend, but that doesn't give you the full story.
Here are some of the costs that often get forgotten when you’re plugging numbers into a customer acquisition cost calculator:
- Team Salaries: A portion of what you pay your marketing folks.
- Software Subscriptions: Your ESP, analytics tools, and all the other MarTech subscriptions.
- Agency & Freelancer Fees: The money going to your ad agency, content creators, or consultants.
- Creative Costs: Everything from photoshoots and video production to ad design.
The second pitfall is getting stuck on that single, store-wide CAC number. It feels simple, but it hides the truth. That one number can’t tell you which channels are actually making you money and which are just a budget black hole. You absolutely need a granular, channel-level view to grow smart.
How Can I Actually Lower My Customer Acquisition Cost?
Bringing your CAC down isn’t just about tweaking your ad campaigns; it's a holistic game. You need to look at the entire customer journey, from first click to repeat purchase.
First, zero in on your on-site conversion rates. Better landing pages and a frictionless checkout can work wonders. Then, shift your focus to retention. When you increase your LTV, you can afford to spend a bit more to acquire a customer. Things like personalized email flows and a solid loyalty program are your best friends here.
Finally, you have to know your numbers. Use a proper analytics tool to clearly see which acquisition channels are your winners. Double down on what's working, and don't be afraid to cut the losers loose.
Tired of wrestling with spreadsheets to get a clear, real-time picture of your CAC? MetricMosaic is the AI-powered growth co-pilot for Shopify that pulls all your data together and actually tells you the story behind the numbers.
See exactly which channels and campaigns are driving profitable growth. Start your free trial today.