Retention Rate vs Churn Rate: A Shopify DTC Brand Guide
Understand the difference between retention rate vs churn rate. Learn how to calculate, track, and improve these key metrics for your Shopify DTC brand.
As a Shopify founder, you're constantly pouring budget and energy into ads, hoping to acquire new customers. But does it ever feel like you're filling a leaky bucket? You bring customers in the front door, only to watch a huge chunk of them slip out the back after just one purchase. Your Shopify dashboard shows sales, but the reports are fragmented, and it's hard to tell if you're actually building a profitable business or just spinning your wheels on an acquisition treadmill.
This frustrating cycle is where the battle between retention rate vs churn rate is fought. They are two sides of the same growth coin. Retention rate measures the percentage of customers who stick around, while churn rate measures the percentage who leave. Understanding this dynamic is the first step to building a sustainable, high-growth DTC brand.
The Two Sides of Your DTC Growth Coin
A high retention rate is a powerful signal of strong product-market fit and a customer experience that resonates. On the flip side, a high churn rate is a red flag, pointing to friction in your product, pricing, or post-purchase journey. The real challenge isn't just tracking these numbers; it's digging into the why behind them. Manually crunching numbers from different Shopify reports is a time-sink and often leads to unreliable insights.
This is where AI-powered analytics transforms complexity into clarity. Instead of just giving you a number, next-gen tools tell you the story behind it, turning raw store data into a competitive advantage.
This infographic lays it out perfectly, showing how retention and churn define the very core of customer loyalty.
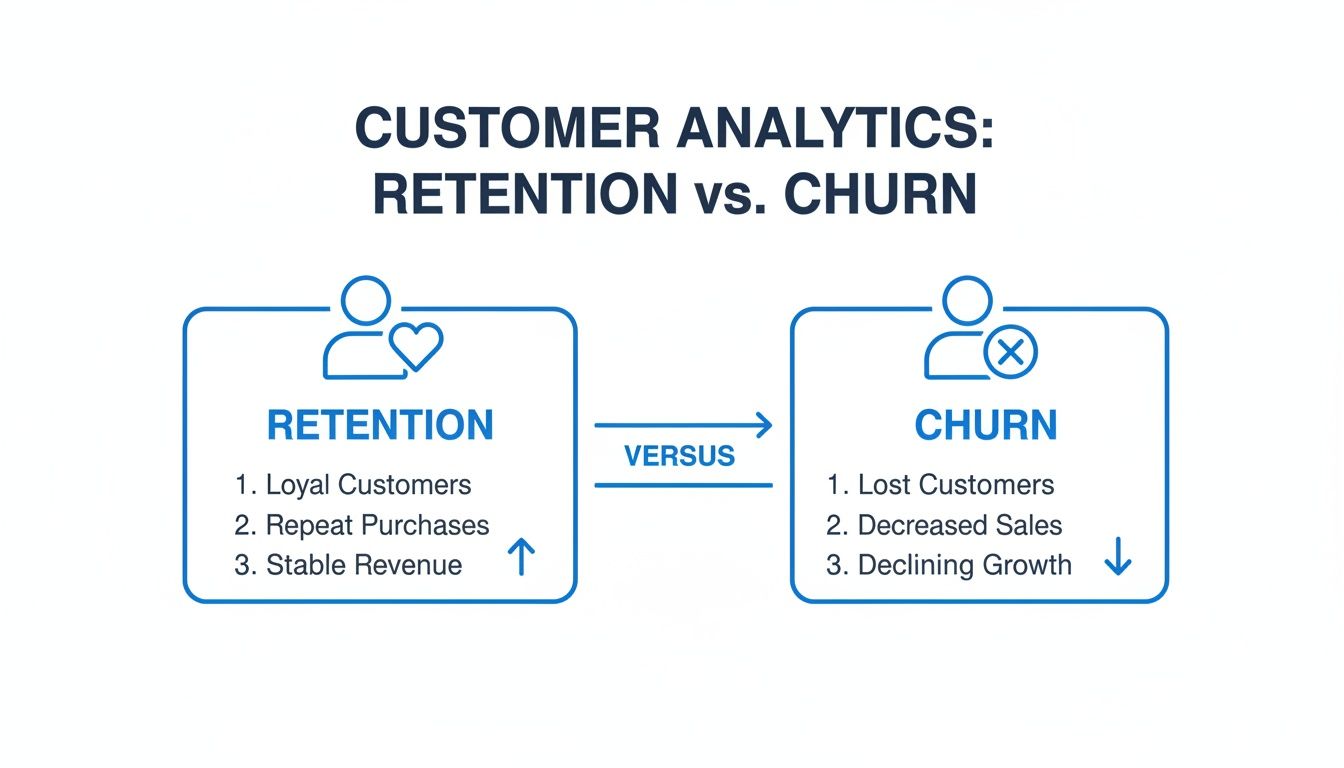
As you can see, a focus on retention builds a stable foundation of repeat buyers. Ignoring churn means you're just constantly scrambling to replace lost revenue, which puts a huge strain on your profitability and ROAS.
Retention Rate vs Churn Rate at a Glance
This table breaks down the fundamental differences. While mathematically related, they answer very different strategic questions for your Shopify brand.
| Metric | What It Measures | The Core Question It Answers | Primary Goal |
|---|---|---|---|
| Retention Rate | The percentage of customers who continue to purchase over a set period. | "How good are we at keeping our customers?" | Increase the percentage of loyal, repeat buyers. |
| Churn Rate | The percentage of customers who stop purchasing over a set period. | "Why are our customers leaving us?" | Decrease the percentage of customers who leave. |
Ultimately, one tells you what's working, and the other tells you what's broken. You need both to get the full picture of your store's health.
Shifting From Reports to Action
The real challenge for DTC operators isn’t just calculating these metrics; it's acting on them. Manually wrestling with spreadsheets and fragmented Shopify reports is slow and prone to error. You need to know which customers are churning and why.
This is where AI-powered analytics tools like MetricMosaic completely change the game for DTC brands. Instead of just giving you a number, they tell you the story behind it through conversational and predictive insights. They turn complex data into clear, actionable strategies you can use to boost your customer lifetime value formula and secure your brand's future.
How to Calculate Retention and Churn Accurately
Knowing the difference between retention and churn is one thing; getting the math right is another. Many DTC brands rely on basic Shopify reports, which can paint a dangerously rosy picture of customer loyalty by blending new and returning customers.
Real clarity comes from standardized formulas that separate acquisition from retention.

Here's how to calculate these metrics for your Shopify store without getting lost in a spreadsheet nightmare.
The Basic Formulas for Your DTC Brand
First, pick a time period and stick to it. Monthly is the standard for most eCommerce brands.
- Customer Retention Rate Formula:
[ (Customers at End of Period - New Customers) / Customers at Start of Period ] x 100 - Customer Churn Rate Formula:
[ (Customers Lost During Period) / Customers at Start of Period ] x 100
Notice that crucial detail in the retention formula: you must subtract new customers acquired during the period. This step is critical. It prevents a surge in new sales from masking the fact that your existing customers are walking out the back door.
Let’s run a quick example for a Shopify store. You start the month with 1,000 customers. At the end of the month, you have 950 total customers, but you acquired 50 brand new ones.
- Retention Calculation:
[ (950 - 50) / 1,000 ] x 100 = 90% - Churn Calculation:
[ 100 Customers Lost / 1,000 ] x 100 = 10%
Your retention rate is 90%, and your churn is 10%. They’re perfect inverses, giving you a clean, reliable baseline to measure against.
Moving Beyond Store-Wide Averages
These overall numbers are a decent start, but they hide the real story. Averages lie. They can't tell you if that Black Friday campaign brought in low-quality buyers who vanished after one purchase. They can't tell you if your new post-purchase flow actually boosted loyalty for customers you acquired in Q1.
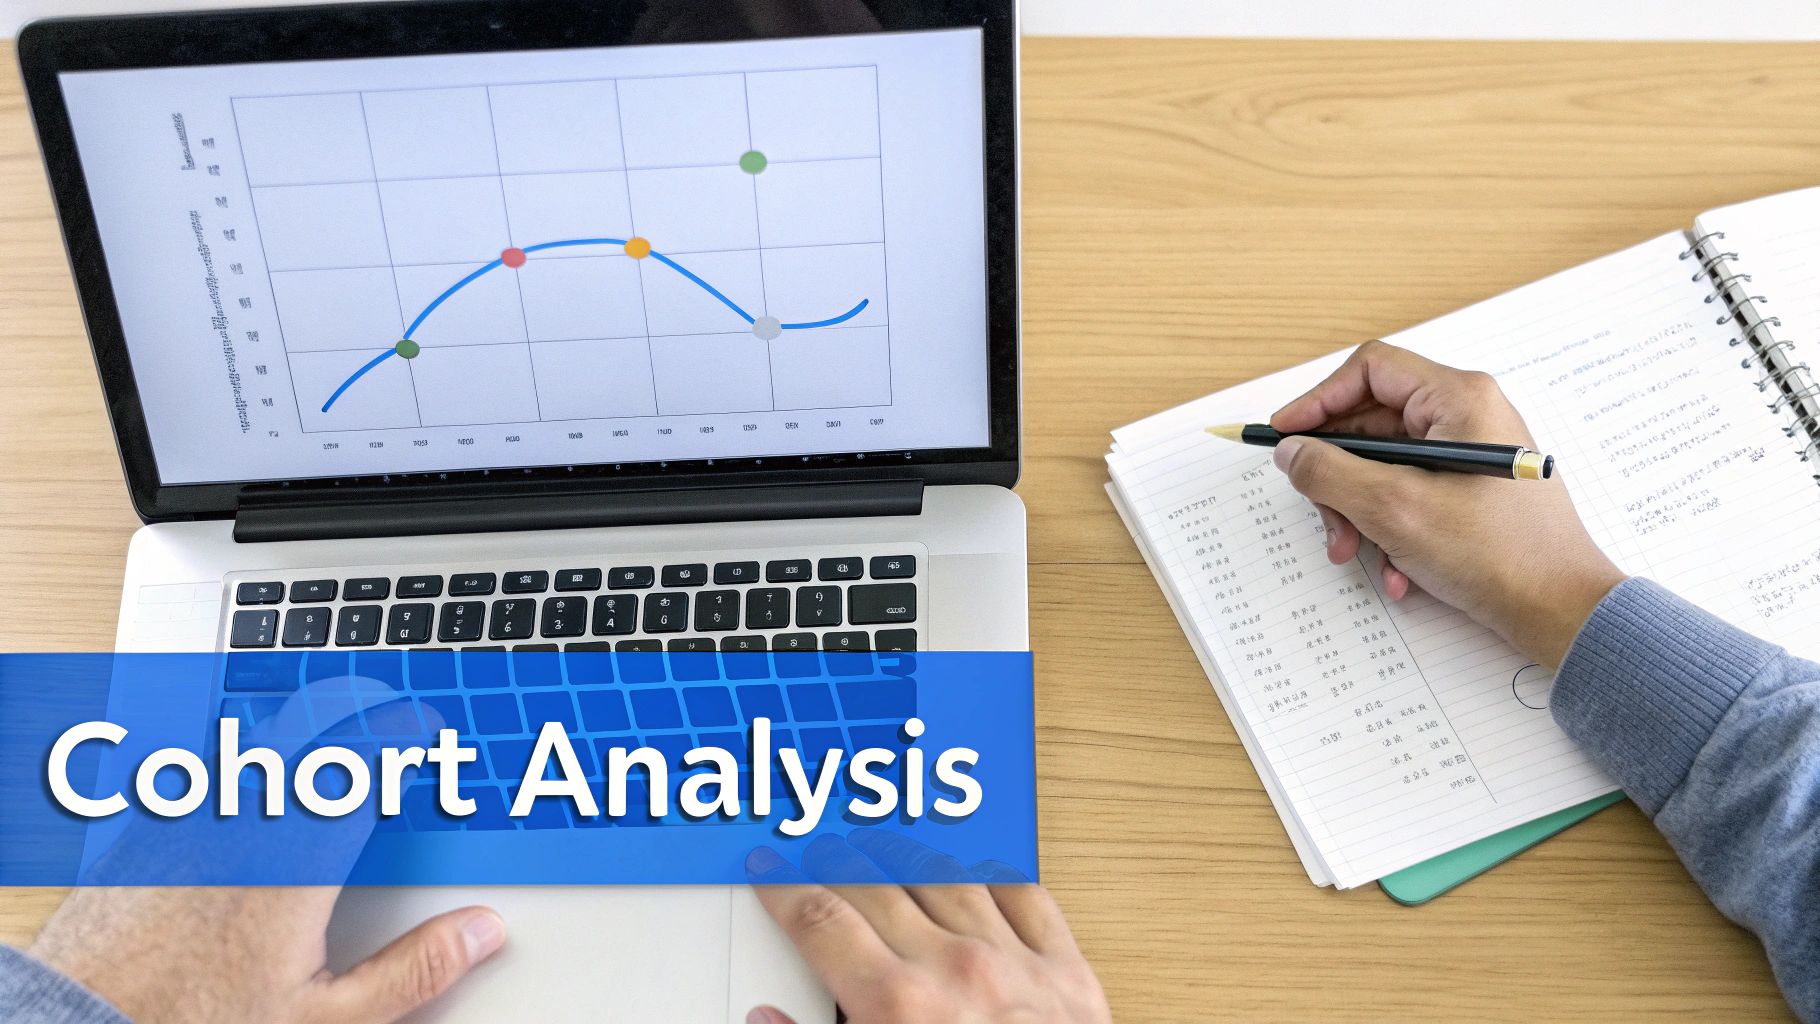
The most powerful way to understand customer behavior isn't by looking at your entire customer base at once, but by analyzing them in groups based on when they were acquired. This is the foundation of cohort analysis.
This is where cohort analysis becomes your secret weapon. A cohort is simply a group of customers who share a characteristic—usually, when they made their first purchase (e.g., the "January Cohort" or "BFCM Cohort").
By tracking the retention of the January Cohort against the February Cohort, you can see the true impact of your marketing strategies and operational changes. It replaces guesswork with proof. You can finally see what’s actually driving long-term value and LTV.
Trying to build these reports manually is a nightmare. It’s why AI-driven analytics platforms automate it. They make it easy to understand the power of cohort analysis and turn those insights into actions that boost profitability.
Why DTC Benchmarks Tell a Brutal but Actionable Story
Alright, you know how to calculate your numbers. Now for the reality check: how does your Shopify store stack up? When you look at retention rate vs churn rate, industry benchmarks tell a brutal story—but one you can use to your advantage.
In the cutthroat world of DTC eCommerce, retention rates often hover around a meager 30%. Compare that to media or professional services, where they can hit 84%. This means for every 100 customers you bring in, only about 30 are coming back for more, leaving you with a churn rate of roughly 70%. That’s a number that can kill your growth and profitability if you ignore it. You can dig deeper into these customer retention rates to get the full picture.
But this isn’t a reason to panic. It’s your call to action.
The Leaky Bucket Opportunity
That 70% churn isn't just a scary statistic; it's your single biggest growth opportunity. Seriously. Think about the impact on your bottom line if you could convince just 5% of those lost customers to stick around. The boost to your profitability would be massive, blowing past any gains from simply throwing more cash at acquiring new, unproven customers and hurting your CAC.
This is where you shift your mindset from failure to focus. Instead of getting discouraged by a low retention rate, see it as a clear roadmap for what to fix. The DTC brands that win are the ones who obsess over plugging these leaks, one customer cohort at a time.
Defying the Averages with AI
So, how do you beat these brutal averages? You can't do it with guesswork or by staring at the same fragmented Shopify reports everyone else uses. The edge comes from using smarter, AI-powered analytics to understand why people are leaving and what makes your best customers stay.
This is where tools like MetricMosaic come in. They automate the kind of deep-dive analysis that used to require a data science team. By connecting the dots between your Shopify store data, marketing campaigns, and customer behavior, you get proactive, predictive insights—not just rearview-mirror reports.
You can see it in action with cohort analysis, which lets you instantly spot trends in customer loyalty over time.
With AI, you can instantly see which monthly cohorts are performing best. This lets you double down on what worked (like a specific ad campaign or welcome offer) and fix what didn't before the damage spreads. Instead of reacting to last quarter's bad news, you can proactively spot at-risk segments and launch targeted campaigns to keep them engaged.
And that’s how you turn a brutal benchmark into your brand’s biggest competitive advantage.
When to Focus on Retention vs. Churn
As a Shopify founder, you're constantly juggling priorities. You have limited time, limited resources, and an endless to-do list. When it comes to customer loyalty, a big question often comes up: should you be working to increase your retention rate or decrease your churn rate?
They’re two sides of the same coin, but the lens you use should shift depending on your brand's stage. Knowing where to focus stops you from chasing the wrong metrics and helps you ask smarter questions of your data—no analyst required.
Scenarios for Prioritizing Retention
If you're an early-stage DTC brand, your focus should be on retention. Fretting over why a handful of one-time buyers didn't come back is less valuable than digging into what makes your small, loyal customer base stick around.
Your main goal is validating product-market fit. You need to find those "magic moments" in the customer journey that turn a casual buyer into a loyal fan.
- Who are your first 100 loyal customers? Use AI-powered analytics to understand their behavior inside and out. This profile can fuel lookalike audiences for future campaigns with lower CAC.
- What did they buy first? This is gold. It can shape your welcome offers, product bundles, and ad creative.
- How long did it take them to purchase again? This tells you exactly when to time your post-purchase email and SMS flows to maximize LTV.
Focusing on these retention drivers builds a rock-solid, profitable foundation for growth.
Scenarios for Prioritizing Churn
For more mature or subscription-based DTC brands, the spotlight tends to shift toward churn. Once you have a significant customer base, even a tiny uptick in churn can have a massive impact on your bottom line. At this scale, churn becomes a critical diagnostic tool.
A rising churn rate can be a red flag for a specific problem—a slip in product quality, a clunky user experience, or a new competitor. This is where AI-driven analytics really shine. By using churn prediction models, you can stop reactive damage control and start proactively identifying at-risk customers before they even think about leaving, a key trend in next-gen analytics.
Globally, the average customer retention rate is about 75.5%, which implies a 24.5% churn. But retail gets hit harder, sitting at just 63% retention. Many Shopify DTC brands actually do worse, with fragmented data amplifying churn to 70% or more. You can find more insights in these customer retention statistics on Zippia.com.
Actionable Strategies to Improve Your Metrics
Knowing your retention and churn rates is just the beginning. The real work is moving from tracking to taking action. For a busy Shopify founder, this means focusing on high-impact, data-driven tactics that don’t require an army of analysts to execute.
The strategies that move the needle aren't generic. They're direct responses to what your unified Shopify, email, and ad data is telling you. This is where an AI-powered analytics platform becomes your co-pilot, turning a sea of raw numbers into a clear action plan to improve AOV, LTV, and overall profitability.
Uncover and Activate Your Best Customers
Your most valuable insights are hiding within your best customer segments. By running a cohort analysis, you can pinpoint the specific groups of customers who stick around the longest and have the highest lifetime value.
Once AI helps you find them, the goal is to replicate their success. Dive into their purchasing habits to build a highly targeted loyalty program or a VIP email flow that speaks directly to them, reinforcing the exact behaviors that made them so valuable in the first place.
Personalize the Post-Purchase Experience
The moments immediately after a purchase are your best shot at securing the next one. Instead of a generic "thank you" email, use repeat purchase data to craft a deeply personalized post-purchase flow that works.
- Analyze Purchase Cadence: If your data shows customers who buy a specific skincare product tend to repurchase every 45 days, set up an automated email reminder with a small incentive that goes out around the 40-day mark. AI can automate this analysis, saving you hours of manual data crunching.
- Recommend Smart Cross-sells: Use market basket analysis to see what products are frequently bought together. This lets you recommend items in your follow-up emails that customers are statistically likely to want, boosting both AOV and their loyalty.
Churn rates in DTC eCommerce can often exceed 50% annually when retention languishes, a stark contrast to top performers who achieve 98.5% retention through an obsessive focus on the customer journey. You can learn more about how different industries compare in the 2025 medians from CustomerGauge.
Get Proactive with Predictive Win-Backs
The old way of handling churn was reactive—sending a "we miss you" email months after a customer has moved on. With predictive churn models, you can identify customers who are at risk of leaving and step in before it's too late.
This AI-driven approach flags customers based on declining engagement, longer gaps between purchases, or other subtle signals. From there, you can launch a proactive win-back campaign with a compelling offer. This strategy pairs powerfully with advanced segmentation. For a deeper dive, check out our guide on how to use RFM customer segmentation to identify and target these at-risk groups.
It's not all about marketing, either. Technical performance plays a role. Exploring tactics like optimizing page load speeds for user retention can offer surprising insights into making your site stickier. Each of these strategies shows the shift from passive reporting to active, data-informed growth, turning your store's data into your biggest advantage.
Let’s be honest: the biggest challenge for Shopify founders isn't a lack of data. It’s the gap between seeing that data and feeling confident enough to make a decision. Your standard Shopify dashboard is great for telling you what happened, but it falls short when you need to understand why it happened and what to do next.

The new wave of story-driven analytics tools is changing this dynamic by automatically surfacing the risks and opportunities buried in your numbers. Imagine getting a plain-English alert that churn just spiked for customers who bought a specific product, complete with a recommended action. That's the future.
It's Time for Predictive Analytics
This is where predictive analytics gives you a real competitive edge. Instead of just looking back at who already churned, AI can actually forecast which customers are likely to leave in the near future.
By calculating predictive LTV and identifying at-risk segments, you can invest marketing dollars with precision, targeting the customers who will have the biggest impact on your bottom line and profitability.
It's time to stop drowning in spreadsheets. The real power comes from using AI-driven, story-based analytics to turn your Shopify store’s data into your most valuable growth asset.
A Few Lingering Questions
Even after getting the formulas down, founders often have practical questions about putting retention and churn metrics to work. Here are some of the most common ones that come up in our conversations with Shopify brands.
What's a Good Retention Rate for a Shopify DTC Brand?
While top-tier brands might see numbers north of 60%, a really solid goal for a growing Shopify store is to hit a 25-30% repeat customer rate within 90 days.
Honestly, the most important benchmark is your own, tracked over time. Don't get lost comparing yourself to others. Focus on making steady, incremental gains. Even a small lift in retention can have a huge impact on your profitability.
How Often Should I Be Calculating This Stuff?
For most DTC brands, we recommend looking at retention and churn rates on both a monthly and quarterly basis. This gives you both a tactical and a strategic view.
- Monthly Checks: This is your pulse check. It helps you see the immediate impact of a new marketing campaign, a product launch, or a change to your post-purchase flow.
- Quarterly Reviews: This zoom-out view smooths out the weekly noise. It gives you a more stable picture of your business's health and helps you spot bigger, more meaningful patterns in customer behavior.
Is It Possible to Have High Retention and High Churn?
It’s unusual, but it can happen. When we see this in a Shopify store's data, it often points to a specific business model—perhaps one with many one-time seasonal buyers alongside a core group of super-loyal customers who buy year-round.
A high retention/high churn scenario is a sign that you have fantastic product-market fit with a specific niche, but you're failing to convert a huge chunk of first-time buyers into repeat customers. It’s a massive red flag from your data telling you to dig into the journey of those one-and-done customers.
Ready to turn your Shopify data from a confusing liability into your greatest asset? The first step is to stop guessing and start getting clear, actionable answers. MetricMosaic connects all your store data and uses AI to deliver story-driven insights that help you boost retention, slash churn, and grow profitably.