A Founder's Guide to Omni Channel Analytics for Shopify Brands
Stop guessing. This guide to omni channel analytics shows Shopify brands how to unify marketing data, decode profitability, and drive scalable DTC growth.
If you're running a Shopify store, this probably sounds familiar: you're jumping between your Meta Ads manager, Google Analytics, your Klaviyo dashboard, and the Shopify admin, but the numbers never seem to add up.
Meta is proudly taking credit for a 4x Return on Ad Spend (ROAS), but your bank account is telling a much less optimistic story. So you're stuck in spreadsheet hell, manually trying to stitch together a narrative from a mess of conflicting reports. It's a daily grind that leaves you guessing the answers to your most important growth questions:
- Which of my ad campaigns are actually profitable?
- Where do my most valuable, high-LTV customers really come from?
- What's my true, blended Customer Acquisition Cost (CAC) across all channels?
This isn't just a reporting headache; it's a massive growth blocker. When your data sources don't talk to each other, you're making critical budget and strategy decisions completely in the dark. You're flying blind, unable to confidently scale what's working or cut what's bleeding you dry.
Why Your Shopify Data Is Lying to You
The core problem is that each platform—Meta, Google, Klaviyo—tells its own version of the truth, usually optimized to make its own performance look good. Meta will happily take credit for every conversion it ever touched, while your Shopify store often only sees the very last click. This fragmentation makes it impossible to see the full customer journey.
The result? Misallocated ad spend, unreliable reports, and a ton of missed opportunities to improve profitability.
This is where omni channel analytics stops being a buzzword and becomes your most critical tool. It's the practice of pulling every scattered data point from your DTC stack into a single source of truth. It lets you move past siloed reports and finally see how everything actually works together to drive sales and profit.
For Shopify brands, omni channel analytics isn’t just about better reports. It's about getting total clarity on your profitability and gaining the confidence to make smarter, faster growth decisions without all the guesswork.
To highlight just how different this approach is, let's look at the old way versus the new way.
The Old Way vs. The Omni Channel Way
| Challenge | Fragmented Analytics (The Old Way) | Omni Channel Analytics (The New Way) |
|---|---|---|
| Data View | Siloed reports from Shopify, Meta, GA4 that don't match up. | A single, unified view of the entire customer journey across all channels. |
| Attribution | Last-click or platform-inflated models that hide true performance. | Blended, multi-touch attribution models that show the real impact of each channel. |
| Decision Making | Guesswork based on conflicting data and gut feelings. | Confident, data-backed decisions on budget allocation and strategy. |
| Workflow | Hours wasted in spreadsheets trying to manually connect the dots. | Automated data integration and modeling, freeing up your time for strategy. |
| Key Metrics | Inaccurate ROAS, CAC, and LTV calculations. | A true, blended understanding of profitability and customer value. |
The shift is clear: moving from a constant state of confusion to one of conviction.
Turning Complexity into Clarity with AI
Not long ago, building this unified view would have required a dedicated data engineering team and months of tedious manual work. Today, AI-powered analytics platforms transform this complexity into clarity.
They connect directly to your Shopify store, ad platforms, and email tools in minutes, handling all the messy data crunching and modeling behind the scenes. You can learn more about overcoming these data silos in a comprehensive guide to e-commerce omnichannel.
Instead of fragmented reports, you get a clear, story-driven view of your business performance. The goal is to turn your everyday store data into a powerful competitive advantage. For more on how to create this unified view, check out our guide on building effective data analytics dashboards.
Building Your Single Source of Truth
So, how do you go from a tangled mess of disconnected reports to a single, reliable view of your business? As a DTC founder, the idea of data integration can sound complex and expensive, bringing up images of needing a whole data engineering team on standby.
The good news is that modern, AI-powered analytics platforms have completely changed the game. You no longer need to be a technical wizard to build your single source of truth. It’s really about connecting the essential tools you already use every day to create one unified data foundation.
This whole process is about turning fragmented data points into a clear, actionable story about your business.
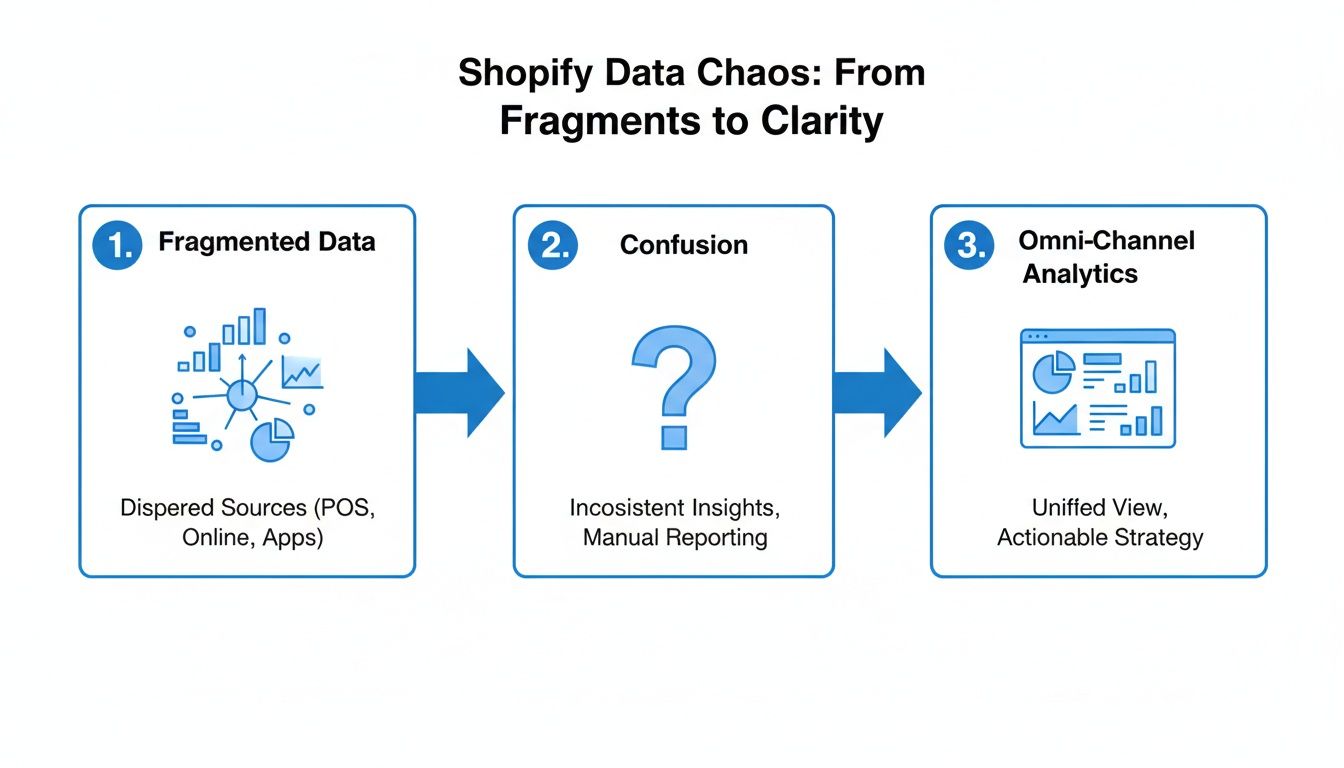
As you can see, moving from scattered data sources—which just create confusion—to a unified omni-channel dashboard brings immediate clarity. You can finally see what’s actually happening.
Connecting Your Core DTC Stack
Building this unified view starts by plugging in the platforms you live in every day. Each integration adds another critical piece to the puzzle, giving you a complete picture of your customer's journey from their very first click to their tenth purchase.
Let's break down the most crucial connections for any Shopify brand:
- Shopify: This is the heart of your operation. Connecting Shopify provides the ground truth for all your core sales data—orders, revenue, AOV, product performance, and customer info. It's the transactional backbone of your entire analytics setup.
- Ad Platforms (Meta & Google Ads): This is where you get the other side of the equation: cost. Integrating your ad accounts pulls in your ad spend, impressions, clicks, and campaign data. Without this, calculating a true, blended Customer Acquisition Cost (CAC) is just a guessing game.
- Google Analytics 4 (GA4): While ad platforms tell you about paid acquisition, GA4 gives you that broader view of your website traffic and user behavior. It helps you understand how visitors from all sources—organic, direct, referral—interact with your site before they buy.
- Klaviyo (or your ESP): This connection adds the crucial customer lifecycle and retention layer. By plugging in Klaviyo, you can analyze email and SMS performance, track customer segments, and measure repeat purchase rates. This adds some serious context to your LTV calculations.
A critical first step in all of this is carefully choosing the right ecommerce analytics software. The right platform will make these integrations seamless, often getting you connected with just a few clicks.
Demystifying Data Modeling with AI
Once your tools are connected, the real magic begins. This is where AI replaces manual data crunching. In the past, concepts like data modeling and data cleansing were the heavy lifting that required data scientists. Today, AI handles it automatically.
Think of it like this: your raw data from each platform is like a pile of LEGO bricks of different shapes and colors. Data modeling is the AI-driven process that intelligently sorts, cleans, and connects these bricks. It understands that a "customer" in Shopify is the same person as an "email subscriber" in Klaviyo and the same user who clicked your Meta ad.
This automated process is what creates that unified view. It ensures that when you look at a metric like LTV for a specific ad campaign, you're seeing a trustworthy number that accounts for data from every relevant source. This is also a core part of managing your customer information, a topic we dive deeper into in our guide to building a first-party data strategy.
Let’s look at a real-world Shopify brand scenario. A DTC brand selling supplements wants to understand its true blended CAC. Manually, they would have to export spend data from Meta Ads and Google Ads, pull new customer data from Shopify, and try to stitch it all together in a spreadsheet. It’s a nightmare—time-consuming and full of errors.
With an AI-powered, unified system, this calculation is instant and automated. The platform simply pulls the total ad spend from all connected channels and divides it by the total number of new customers acquired in the same period. Just like that, the founder has a reliable, blended CAC they can use to make confident budget decisions. That’s the power of a single source of truth in action.
Decoding Attribution and True Profitability
Let's talk about the million-dollar question that keeps DTC founders up at night: attribution. You're pumping money into Meta, Google, and TikTok, but can you say with total confidence which channels are actually driving profitable growth?
If you're hesitating, you're not alone. The modern customer journey is a tangled mess.
Someone might see a Meta ad on their phone, get a retargeting email from Klaviyo a day later, click a Google Shopping ad on their laptop, and then finally buy. The problem? Each of those platforms will take 100% of the credit, leaving you to piece together the real story. This is precisely why omni channel analytics isn't just a nice-to-have anymore—it's a survival tool for decoding what's really working.
Beyond Last-Click: Why You Need a Blended View
For years, the default for Shopify brands has been last-click attribution. It’s simple: whatever a customer clicked right before buying gets all the glory. But in today’s world, this model is fundamentally broken. It completely ignores every other touchpoint that warmed up the customer and built awareness along the way.
The real solution isn't to pick one flawed model over another. It's to embrace a blended attribution model—one that’s powered by your own unified data. This approach looks at the entire customer journey and assigns partial credit to multiple touchpoints, painting a far more realistic picture of channel performance. We dive deeper into this in our complete guide on multi-touch attribution modeling.
A blended model shifts the question from "Which one channel worked?" to "How do my channels work together to drive sales?" That perspective shift is everything.
A Playbook for Measuring True Profitability
Once you get your attribution sorted, you can finally calculate the profitability metrics that matter with genuine confidence. An AI-powered analytics platform automates all of this, pulling data from every source to give you instant, reliable answers.
Here’s a practical playbook for how it works:
- Calculate a True Blended CAC: Forget relying on Meta's inflated numbers. An omnichannel view takes your total ad spend from all platforms (Meta, Google, TikTok, etc.) and divides it by the total number of new customers from Shopify during that period. This gives you one clear, trustworthy blended Customer Acquisition Cost (CAC).
- Measure ROAS with Confidence: With a unified view, you can finally see a reliable Return on Ad Spend (ROAS). The system connects ad spend directly to actual Shopify sales, showing you which campaigns are truly generating a profit and which are just burning cash.
- Understand LTV by Channel: This is where things get really powerful. You can now segment customers by their first touchpoint and track their Lifetime Value (LTV) over time. You might find that customers from Google Ads have a higher initial AOV, but customers from your Klaviyo welcome series have a much higher LTV over six months. This insight is gold for optimizing your ad spend for long-term profitability, not just first-purchase revenue.
Drilling Down to Product-Level Profitability
A unified data view doesn't just clarify channel performance; it can completely transform your merchandising strategy. Most Shopify brands know their total revenue, but very few can instantly see their profitability per product.
Imagine being able to see not just which products are bestsellers, but which ones have the best profit margins after all costs are factored in. Omni channel analytics makes this possible by connecting your Shopify sales data with cost-of-goods-sold (COGS) information.
With this insight, you can finally identify:
- High-Revenue, Low-Margin Products: These might be your bestsellers, but they aren't driving as much profit as you think.
- Hidden Gems: Lower-volume products with massive margins that you should be promoting more heavily.
- Loss Leaders: Products that are actually losing you money on every single sale.
This product-level view allows you to make much smarter decisions about inventory, marketing, and pricing. You can focus your ad spend on your most profitable items, bundle high-margin products with bestsellers to lift AOV, and strategically adjust pricing to protect your bottom line. It’s about moving from a revenue-focused mindset to a profit-first strategy, all driven by data you can finally trust.
Unlocking Growth with Cohort Analysis
Customer acquisition is a grind. For DTC brands, it’s getting more expensive and crowded by the day. And while a solid acquisition strategy is non-negotiable, the brands that actually last are built on retention.
This is where the lifecycle side of omni channel analytics really starts to pay dividends. We have to move beyond first-purchase metrics like ROAS and CAC to see the bigger picture of long-term customer value.
The secret weapon here? Cohort analysis.
Instead of dumping all your customers into one giant bucket, cohort analysis groups them by a shared trait—like when they made their first purchase or which channel brought them in—and then watches how they behave over time. This is how you find out who your real best customers are and improve retention.
If you want to go deeper on the fundamentals, we have a whole guide on what is a cohort analysis that breaks it down.
A Tale of Two Cohorts
Let's make this concrete. Say your Shopify store just finished Q4. You ran two big acquisition campaigns: a huge Black Friday/Cyber Monday (BFCM) promotion and a promising influencer campaign that launched in early October. On the surface, revenue from both looks great. But which one actually brought in better customers for the long run?
Without cohort analysis, you're just guessing. But with an AI-powered analytics platform, you can create two distinct cohorts:
- The "BFCM 2023" Cohort: All new customers whose first purchase was during the Black Friday sale.
- The "October Influencer" Cohort: All new customers who came from that specific influencer campaign.
Now, you track these two groups for the next 90 days. You might find the BFCM cohort, while massive, was mostly full of one-and-done deal hunters. Their repeat purchase rate is flat, and their Lifetime Value (LTV) stalls out right after that first discounted order.
The influencer cohort, on the other hand, might be smaller but way more engaged. They’re coming back for second and third purchases at full price, sending their LTV through the roof.
This is the kind of insight that changes everything. You just went from asking, "Which campaign drove the most initial sales?" to "Which campaign acquired my most valuable, long-term customers?" The answer completely reshapes how you'll spend your budget next year.
Maximizing LTV and Your LTV-to-CAC Ratio
This cohort comparison is how you maximize LTV. More importantly, it’s how you improve your LTV-to-CAC ratio—the single most important health metric for a DTC brand. Once you know which channels deliver high-LTV customers, you can double down on them with confidence, dramatically improving your overall profitability.
The AI Advantage in Cohort Analysis
Trying to run these cohort analyses manually in a spreadsheet is a special kind of hell. It means exporting giant CSVs from Shopify, your ad platforms, and your ESP, then trying to VLOOKUP your way to an answer. It's slow, painful, and practically guaranteed to have errors.
This is where modern, AI-powered platforms like MetricMosaic make a huge difference. They put the entire process on autopilot.
- Automated Segmentation: AI tools can automatically spot and create meaningful cohorts based on acquisition channel, first product purchased, discount codes, and dozens of other signals.
- Instant LTV Tracking: You can watch the LTV of any cohort unfold in real-time without building a single spreadsheet formula.
- Predictive Insights: Next-gen tools can even use AI to predict the future LTV of new cohorts. Imagine knowing within days—not months—that customers from your new TikTok campaign are on track to be incredibly profitable.
This automated, predictive power turns what was once a complex data science project into an accessible, everyday tool for growth. It helps you move faster, make smarter calls, and build a more resilient, profitable brand by focusing on what actually matters: keeping your best customers coming back.
Turning Your Data Into Actionable Growth Plays
Let’s be honest: data is just a bunch of numbers until you actually do something with it. After you’ve unified your data streams and dug into cohort analysis, the final—and most important—step is turning those insights into tangible growth.
This is where your omnichannel analytics platform stops being a reporting tool and becomes your proactive growth co-pilot. The goal isn't to build yet another dashboard; it's to create specific, data-backed "plays" that directly move the needle on your key metrics—ROAS, LTV, AOV, and profitability. An insight is only as valuable as the action it inspires.
From Insight to Action: Concrete Playbooks
It's time to move from theory to reality. Your unified data will constantly surface opportunities. The real trick is recognizing them and having a playbook ready to go. This is how you create a powerful feedback loop where insights from your analytics directly fuel your marketing and retention efforts.
Here are a couple of real-world scenarios I see with Shopify brands all the time:
The Insight: Your cohort analysis reveals that customers acquired from a specific TikTok campaign have a killer first-order AOV but a dismal repeat purchase rate. They're valuable upfront but vanish almost immediately.
The Growth Play: You jump into Klaviyo and create a segment for this exact TikTok cohort. Then, you build a targeted post-purchase flow designed to do one thing: secure that crucial second purchase. This could be a compelling offer, a showcase of user-generated content from other TikTok buyers, or a quick survey to figure out why they aren't coming back. You’re using data to fix a leaky bucket and boost LTV.
The Insight: Your blended attribution model shows a particular Meta Ads campaign is acquiring customers with a high predicted LTV and a fast 60-day CAC payback.
The Growth Play: This is a crystal-clear signal to scale. You confidently increase the budget for that specific campaign, knowing it's not just driving top-line sales but acquiring profitable, long-term customers. You're pouring gas on what's proven to work, backed by unified data.
Empowering Your Team with Conversational Analytics
In a fast-moving DTC brand, you can't afford to have your data locked away with one "analytics person." Growth ideas can come from anywhere—your marketing manager, your customer service lead, or even you, the founder, at 10 PM on a Tuesday. This is where next-gen trends like conversational analytics are changing the game.
Imagine being able to just ask your data questions in plain English, the same way you'd ask a team member.
Instead of navigating complex dashboards, your team can simply type:
- "What was our blended ROAS last week for the new spring collection campaign?"
- "Show me the LTV of customers who bought Product X first."
- "Which discount code drove the most new customers in May?"
This is the power of AI-driven platforms like MetricMosaic. They make sophisticated omnichannel analytics accessible to everyone on your team, which is the key to building a truly data-driven culture. It removes the friction between curiosity and insight, letting anyone get instant, reliable answers without needing to know SQL or how to build a report.
Your analytics platform shouldn't just be a place to look at historical data. It should be an interactive partner that helps you strategize for the future, telling you not just what happened, but what to do next to improve profitability.
Making Your Analytics a Growth Co-Pilot
Ultimately, the goal is to transform your analytics from a passive reporting system into an active growth engine. Modern AI can now surface proactive insights and story-driven recommendations, telling you where to focus your attention.
It might send you an alert saying, "The 90-day LTV of customers from your Google Ads 'Brand Search' campaign has increased by 15% month-over-month," giving you a clear signal to investigate what's driving that positive trend. Or it might flag that a specific product is frequently purchased with another, suggesting a bundle to increase your store's AOV.
This is the future of analytics for Shopify brands. It’s not about spending more hours staring at charts. It's about having an intelligent system that does the heavy lifting, connecting the dots across all your channels and serving up clear, actionable growth plays you can execute immediately. This proactive approach turns your everyday store data into your most powerful competitive advantage.
Got Questions About Omni Channel Analytics?
As a Shopify founder, you're constantly weighing where to invest your time and money for the best possible return. It's only natural to have a few questions before you dive into omnichannel analytics. Let's tackle some of the most common ones I hear from brands just like yours.
The goal here isn't to add another layer of complexity to your life. It's to give you the clarity you need to grow faster and, more importantly, more profitably.
Is This Just for Big Shopify Plus Brands?
Absolutely not. This is a common misconception. While enterprise brands have been doing this for years, newer AI-powered platforms have made omnichannel analytics completely accessible and affordable for growing Shopify stores. The problem of siloed data doesn't care if you're doing $500k or $50M in revenue—it hurts everyone.
In fact, getting a clear view of your true blended CAC and LTV by channel is even more critical when every dollar counts. Building this data foundation early on is a massive competitive advantage. It lets you scale smarter and faster than the competition.
How Long Does It Take to Get Started?
Forget what you've heard about traditional BI tools. We're not talking about months-long implementations that require a team of developers. With AI-powered platforms built specifically for the DTC world, the whole process is ridiculously fast.
You can connect your core data sources—your Shopify store, Meta Ads, GA4, Klaviyo, etc.—in just a few minutes with simple, one-click integrations. The platform then does all the heavy lifting in the background, pulling, cleaning, and modeling the data automatically. This means you can have a fully working dashboard with real insights within 24-48 hours, not weeks.
The biggest shift is moving from a long, painful manual setup to an automated, almost instantaneous one. Modern tools are built for speed because founders don't have time to wait for answers.
How Does This Actually Improve My Email Marketing?
This is where things get really powerful. By bringing your Klaviyo data into the same place as your sales data (Shopify) and acquisition data (ads), you can build customer segments that were impossible to create before.
Imagine being able to create segments like these in just a few clicks:
- High-LTV customers from Google Ads who haven't bought anything in 60 days. You can hit them with a very specific win-back campaign.
- First-time buyers who came from a specific influencer campaign. Now you can nurture them with a welcome flow that actually speaks their language and references the influencer they trust.
- Customers who bought Product A but not the obvious complementary Product B. That's a perfect, targeted cross-sell email waiting to happen.
This is how you move from generic email blasts to highly personalized, data-backed communication that directly boosts your retention and LTV.
What's the Biggest Mistake Brands Make?
The single biggest mistake I see is "analysis paralysis." Brands get so lost in the data and the pretty dashboards that they never actually do anything with the information. A unified view is just step one; the real goal is to make decisions that make you more money.
My advice? Choose an AI-powered platform that doesn't just show you charts but actively points you toward opportunities with recommendations or story-driven alerts. Start small. Pick one key metric you want to improve—like your 60-day LTV to CAC ratio—and use the platform to find and execute on ways to move that number. Action, not just analysis, is what separates the brands that win.
Ready to stop guessing and start growing? MetricMosaic is the AI-powered growth co-pilot for Shopify brands that turns your complex data into clear, actionable profit plays. Unify your data, understand your true profitability, and get the story-driven insights you need to scale with confidence. Start your free trial today and see what your data is really trying to tell you.