How to Calculate Customer Churn Rate: A Shopify Founder's Guide
Learn how to calculate customer churn rate with quick steps, real-world examples, and practical tips to improve retention.
You calculate customer churn rate by taking the number of customers you lost in a period, dividing it by the total customers you had at the start, and multiplying by 100. It's a simple formula that unlocks one of the most vital health metrics for your Shopify brand. But for a growing DTC store, the real challenge isn't the math—it's getting a reliable number without spending hours buried in spreadsheets.
Why Churn Is the Silent Killer of DTC Growth
As a Shopify founder, you're constantly juggling priorities. Your Shopify dashboard shows revenue is climbing, your Meta ad campaigns look good, and new customers are coming through the door. But when you look at your active customer count, it feels like you're just running in place.
That frustrating feeling is the classic 'leaky bucket' problem, and the hole in that bucket is customer churn.
This isn't just about losing a few customers here and there. It's about the compounding damage that slowly grinds down your growth engine. Every customer that churns makes your Customer Acquisition Cost (CAC) less efficient. You're spending good money to acquire customers who don't stick around long enough to become profitable, which directly torpedoes your Lifetime Value (LTV).

The Deceptive Math of Monthly Churn
The real danger with churn is its quiet, cumulative impact. A small monthly churn rate can feel totally manageable, but it adds up to a staggering annual loss. This is exactly where so many DTC brands get a false sense of security from fragmented reports.
Let's say you started January with 1,000 customers and lost 50 by the end of the month, leaving you with 950. Your monthly churn is 5%. Doesn't sound too bad, right?
But here's the kicker: a seemingly low 5% monthly churn compounds to a devastating 46% annual loss. That means nearly half your customer base vanishes every single year.
To really drive this home, look at how quickly a "small" monthly churn rate spirals out of control over the course of a year.
The Compounding Impact of Monthly vs Annual Churn
This table shows how a seemingly small monthly churn rate grows into a significant annual loss of customers, highlighting the urgency of tracking this metric.
| Monthly Churn Rate | Equivalent Annual Churn Rate | Customers Lost Per 1,000 |
|---|---|---|
| 1% | 11.4% | 114 |
| 2% | 21.5% | 215 |
| 3% | 30.6% | 306 |
| 5% | 46.0% | 460 |
| 8% | 65.0% | 650 |
Suddenly, that small percentage doesn't feel so small anymore. You can find more surprising retention statistics in the latest report that confirm just how critical this is.
The biggest mistake I see DTC founders make is underestimating the long-term impact of a 'small' monthly churn rate. It’s not just a metric; it’s a direct reflection of your customer experience and product-market fit.
From Manual Calculation to AI-Powered Clarity
You could manually pull data from Shopify, Klaviyo, and your ad platforms to calculate all this. But it's a tedious, error-prone chore that eats up hours. It gives you a number, but it doesn't give you the story behind it.
This is where AI-driven analytics platforms like MetricMosaic completely change the game. Instead of drowning in spreadsheets, you get an automated, unified view of your retention health in minutes.
AI doesn't just calculate your churn rate; it helps you finally understand it by:
- Segmenting Churn: Automatically breaking down churn by product, acquisition channel, or customer cohort so you know where the problem is.
- Predicting Future Churn: Using predictive insights to identify at-risk customers before they actually leave.
- Answering Your Questions: Letting you ask in plain English, "Which marketing campaign brought in customers with the lowest churn?" and getting an instant, story-driven answer.
Moving forward, we'll dive deeper into the specific formulas. But first, reframe churn from a passive number on a report into an active, strategic lever for sustainable growth. Learning how to calculate customer churn rate is your first step toward plugging the leaks and building a more profitable DTC business.
Picking the Right Churn Formula for Your DTC Brand
Figuring out your customer churn rate feels like it should be simple. But if you’ve been in the trenches of running a Shopify store, you know the standard formula doesn't tell the whole story, especially for a fast-growing DTC brand.
Using the wrong calculation can give you a dangerously skewed view of your business health. You might end up panicking over nothing or, even worse, kicking back and relaxing right when you should be taking action on retention.
The key is realizing your business model dictates the best formula. A subscription box service with predictable monthly revenue needs a different lens than a seasonal apparel brand with unpredictable purchase cycles. Your first job is to get past the one-size-fits-all approach and find the method that actually reflects how your customers behave.
The Standard Churn Formula (And Why It Often Fails Shopify Stores)
Most people start with the most common way to calculate churn, which is pretty straightforward:
(Customers Lost in a Period / Customers at the Start of the Period) x 100
This method is fine for a quick snapshot. The problem? Its biggest flaw is that it completely ignores any new customers you brought in during that same period. If you had a killer month for acquisition, your denominator (starting customers) becomes misleading, which artificially deflates your churn rate and hides potential retention problems under the rug.
This is a classic reporting mistake. It makes DTC brands feel a lot more secure than they actually are. The top-line numbers look good, but a leaky bucket is being masked by a firehose of new customers.
A More Honest Formula for High-Growth Brands
For most Shopify stores that are seeing any kind of growth, you need a more precise formula. This refined calculation uses the average number of customers you had during the period, giving you a much more stable and honest baseline.
(Customers Who Canceled / Average Number of Customers in Period) x 100
This approach smooths out the noise from new customer acquisition. It gives you a much truer sense of how many of your existing customers you're actually losing. It’s the difference between a vanity metric and an actionable one.
For instance, a Shopify store with a subscription model might see its monthly churn hovering around 7%. On the surface, that might not seem bad, but it's a touch above the typical industry norms of 6-8%. The real danger is how this compounds; a 10% monthly churn rate can wipe out over 70% of your customer base in just one year.
Context is everything. While online retail's average annual churn of 22% looks fantastic compared to wholesale's staggering 56%, it's still a number that demands your full attention. You can learn more about how churn rates vary across industries to get a better sense of where you stand.
A shocking 56% of customers don't complain before they leave; they just churn silently. This is exactly why an accurate, sensitive churn formula is so critical. You can't just rely on support tickets to tell you there's a problem.
Voluntary vs. Involuntary Churn
To get even more granular, you have to separate why customers churned. Trying to crunch these numbers by hand is a nightmare, but modern analytics tools can segment this for you automatically. When you do, you’ll find two very different stories.
Voluntary Churn: This is when a customer makes a conscious choice to leave. They cancel their subscription or simply stop buying. This type of churn points directly to issues with your product, pricing, or the overall customer experience you're providing.
Involuntary Churn: This is when a customer leaves by accident, almost always because of a failed payment. An expired credit card or a simple processing error can sever the relationship with a customer who had every intention of sticking around.
Why does splitting them out matter so much? Because the fixes are worlds apart. Tackling voluntary churn means improving your core value proposition. But fixing involuntary churn—which can be 20-40% of total churn—is about improving your operational systems like dunning emails and payment integrations.
If you lump them all together, you'll miss low-hanging fruit and waste money chasing the wrong problems. AI-powered analytics simplify this by automatically distinguishing between the two, so you can make smarter decisions.
A Practical Guide to Calculating Churn With Real Shopify Data
Theory is one thing, but applying it to the messy reality of your own Shopify data is where the rubber meets the road. Let's get our hands dirty and move past abstract formulas into real-world scenarios every DTC founder faces. This is how you turn raw numbers into confident, actionable insights.
The whole process boils down to a few key decisions.
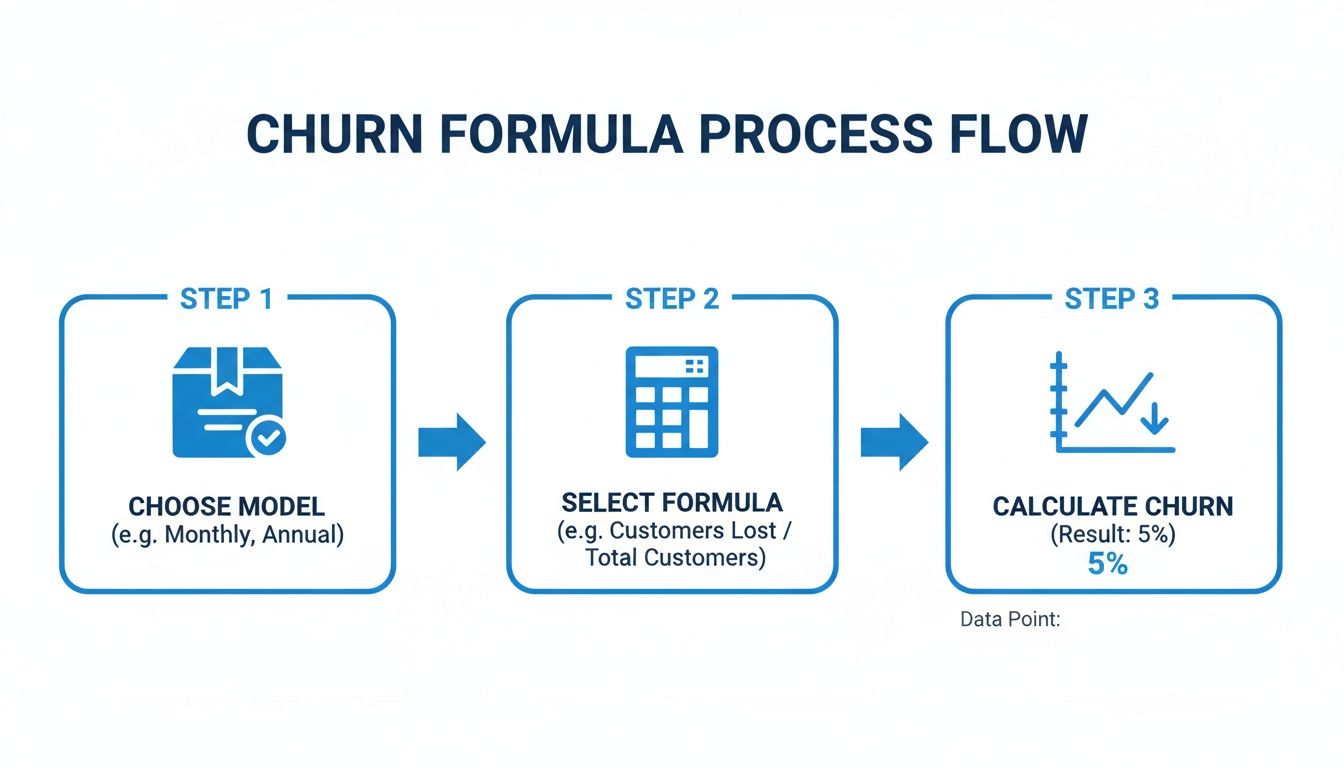
First, you pick a model that actually fits your business. Then, you select the right formula for the job. Only then can you run the numbers and find your churn rate.
Monthly Churn for a Subscription Box
Let's say you run a popular coffee subscription service on Shopify. Your revenue is recurring, which makes monthly churn a critical health metric. We'll calculate it for March.
- Customers on March 1: 2,000
- Customers Lost in March: 150
- New Customers Added in March: 250
- Customers on March 31: 2,100
If you use the basic formula (Lost Customers / Starting Customers), you'd get 7.5%. But that's misleading because it ignores all the growth you had during the month.
A more honest approach uses the average customer count for the period: (2,000 + 2,100) / 2 = 2,050.
Accurate Calculation: (150 Lost Customers / 2,050 Average Customers) x 100 = 7.3% Monthly Churn
It’s a small adjustment, but it gives you a truer picture of retention. This way, a great month for acquisitions doesn't accidentally mask a leaky bucket.
Annual Churn for a Seasonal Apparel Brand
Now, imagine a non-subscription DTC brand selling seasonal apparel. Monthly churn is just too noisy here—of course, nobody's buying winter coats in July. An annual view is far more insightful.
First, you have to define what "churned" even means without a subscription. A common method is to set an inactivity threshold. Let's say your data shows 90% of your repeat customers buy again within 180 days. It's pretty reasonable, then, to define anyone who hasn't purchased in the last 180 days as churned.
- Active Customers on Jan 1, 2023: 10,000
- Customers Considered Churned by Dec 31, 2023: 2,500
Annual Calculation: (2,500 Churned Customers / 10,000 Starting Customers) x 100 = 25% Annual Churn
This annual figure smoothes out the seasonal peaks and valleys, giving you a much clearer sense of long-term loyalty. If you want to go deeper on this, check out this excellent a Shopify merchant's guide to customer retention metrics.
Cohort Churn After a Black Friday Sale
This is where churn analysis gets really powerful. Cohorts help you grade the quality of customers from specific campaigns. Did that big Black Friday push bring in loyal fans, or just a bunch of one-time deal hunters?
Let's look at the group, or cohort, of new customers you acquired in November.
- New Customers Acquired in November: 500
- November Cohort Customers Who Churned by February: 200
Cohort Churn Calculation: (200 Churned Customers / 500 Original Cohort Size) x 100 = 40% Churn within 3 Months
This one number tells a powerful story. Your campaign drove a ton of signups, but their long-term value might be low. This is the kind of insight that helps you tweak future marketing spend and messaging to attract buyers who actually stick around. If you want to get a better handle on this, you might be interested in our guide on what is a cohort analysis and how it can really transform your strategy.
The AI-Powered Advantage in Churn Calculation
Let's be honest: manually pulling these numbers from Shopify, Klaviyo, and your ad platforms is a time-consuming grind. It’s also where errors creep in, especially when you're wrestling with complex definitions of "active" or segmenting different customer groups.
This is precisely the problem AI-driven analytics were built to solve. Instead of you crunching the numbers, the platform does the heavy lifting.
- Automated Calculations: A platform like MetricMosaic automatically calculates your monthly, annual, and cohort churn rates in real-time. No spreadsheets needed.
- Predictive Insights: It goes a step further by using AI to predict which customers are most likely to churn next, so you can actually step in and do something about it.
- Conversational Analytics: You can just ask questions in plain English, like, "Show me the churn rate for customers acquired through our Meta ads in Q4."
This moves you from spending hours in spreadsheets to spending minutes making data-backed decisions that directly improve your bottom line and ROAS.
Going Beyond the Number: What Your Churn Rate Is Really Telling You
Calculating your churn rate is a fantastic start, but let's be honest—the number itself is just the beginning. A flat 5% churn rate tells you what is happening, but it tells you absolutely nothing about why it's happening or, more importantly, who is leaving.
The real magic happens when you move beyond that single metric and start digging into the story hidden inside your Shopify data.

Think of your overall churn rate like a fever. It’s a clear signal that something is wrong, but it doesn't diagnose the illness. To find the cure, you have to start segmenting.
This is the moment you shift from passively reporting on churn to actively diagnosing its root causes. For DTC brands, this means slicing your churn calculation by the dimensions that actually drive your business.
Uncovering the Stories in Your Churn Data
Segmentation is what turns a vague, overwhelming problem into a set of specific, solvable challenges. Instead of a general goal like "we need to reduce churn," you get an actionable mission: "we need to fix the post-purchase experience for customers who buy our starter kit."
Here are a few of the most powerful ways to segment your churn analysis:
- By Acquisition Channel: Are customers from your TikTok ads churning faster than those from organic Google Search? This immediately tells you which channels are bringing in genuinely loyal customers versus one-and-done buyers, directly impacting your CAC and ROAS.
- By First Product Purchased: Do customers whose first purchase was that new skincare bundle have lower loyalty than those who started with your flagship moisturizer? This can point to issues with product quality, mismatched expectations, or poor onboarding for certain items.
- By Discount Code: Did that big 30% off flash sale attract a flood of customers who vanished right after their first purchase? Analyzing churn by discount usage helps you see if your promotions are building LTV or just attracting bargain hunters.
- By Customer Demographics: Is churn suddenly spiking among customers in a specific state or age group? This can inform everything from your marketing messages to your shipping logistics.
Once you have your core customer churn rate calculated, the very next step is a thorough churn rate analysis to unpack these deeper stories. It's how you finally connect the dots between your marketing spend, product strategy, and actual customer retention.
From Raw Numbers to Actionable Insights
For any Shopify founder, getting a handle on churn is a direct line to better profitability. We all know retaining a customer is cheaper than acquiring a new one, and the benchmarks drive this point home.
DTC Churn Rate Benchmarks by Niche
Compare your churn rate against industry averages to see where your Shopify store stands and identify opportunities for improvement.
| Industry / Business Model | Typical Annual Churn Rate |
|---|---|
| General Online Retail / DTC | 22% |
| Consumer Packaged Goods (CPG) | 40% |
| SaaS (for comparison) | 5-7% |
| Food & Beverage | 25% |
| Apparel & Fashion | 30% |
As you can see, the fight for retention is real, especially in competitive DTC niches. It highlights just how critical it is to not only track churn but to understand what's driving it.
Let’s be real. Manually pulling data from Shopify, Meta Ads, and Klaviyo to create these segments is a soul-crushing exercise in spreadsheet gymnastics. It’s painfully slow, riddled with errors, and the insights are usually stale by the time you uncover them.
This manual data grind is where modern analytics platforms create a massive competitive advantage. Instead of wrestling with CSV files, an AI co-pilot like MetricMosaic automatically pulls all your data together and lets you explore these segments in seconds.
You can just ask a question in plain English, like, "What is the churn rate for customers acquired from our spring campaign versus our winter campaign?" The platform delivers the answer instantly, turning what used to be a day of manual analysis into a moment of clarity. For a more detailed look at this process, check out our complete guide to customer churn analysis.
This approach completely changes your relationship with your data. You can finally stop spending all your time finding the numbers and start spending it acting on what they mean for your bottom line.
How AI Turns Churn Data Into a Growth Strategy
Calculating churn manually is a necessary evil, but let’s be honest: it’s slow, full of potential errors, and always backward-looking. By the time you’ve wrestled with spreadsheets from Shopify and your marketing tools, the customers you lost are long gone.
The real challenge for a growing DTC brand isn’t just knowing your churn rate—it's learning how to act on it fast enough to actually make a difference.
This is where the conversation shifts from manual data-pulling to an automated, AI-driven strategy. Next-gen analytics platforms are built to kill the tedious work that holds founders back. They plug directly into Shopify, Meta, Klaviyo, and your other go-to tools, creating a single, reliable source of truth for your retention metrics.
This kind of integration isn’t just a time-saver; it’s a total game-changer. It means your churn calculation is always live and instantly segmentable, without you ever having to export a CSV again.
From Reactive Reports to Proactive Predictions
The biggest leap forward here is moving from looking at historical reports to getting predictive insights. A traditional churn report tells you how many customers you lost last month. An AI-powered platform tells you which customers you’re most likely to lose next month.
That’s the foundation of a proactive retention strategy.
AI models dig through thousands of data points in real-time—subtle signals you’d never catch on your own:
- A customer's purchase frequency is slowly dropping off.
- They've stopped opening your marketing emails.
- Their average order value (AOV) is shrinking.
- Their browsing behavior on your site has changed.
By spotting these tiny patterns, the system can flag at-risk customers long before they’ve made a conscious decision to leave. This opens up a critical window for your team to step in with a targeted win-back campaign, a special offer, or just a personalized check-in. It’s the difference between doing a post-mortem on a lost customer and preventing the loss in the first place.
For founders who want to go deeper, understanding different churn prediction models is a great next step.
Shifting from a reactive to a proactive retention mindset is one of the most profitable changes a DTC brand can make. Instead of asking, "Why did they leave?" you start asking, "How can we make them stay?"
Asking the Right Questions with Conversational Analytics
The final piece of this puzzle is making the data accessible. Advanced analytics are useless if you need a data scientist on staff just to make sense of them. This is where newer trends like conversational analytics are changing how operators interact with their own data.
Instead of building complex reports or wrestling with dashboard filters, you can just ask your analytics platform a question in plain English.
- "Which products have the highest churn rate in the first 90 days?"
- "Show me the LTV of customers we acquired from our holiday sale."
- "What was our churn rate last quarter for customers in California?"
This approach turns every founder and marketer into their own data analyst. It puts powerful insights directly into the hands of the people who can act on them, breaking down bottlenecks and empowering your whole team to make smarter, faster decisions.
In the end, AI doesn't just automate a calculation. It transforms your churn rate from a passive metric into an active, intelligent growth engine that drives smarter ad spend, better customer experiences, and a much more resilient business.
Common Questions About Calculating Customer Churn
Even when you have the formulas down, the reality of calculating churn for a Shopify store can surface some tricky questions. Let's walk through the most common sticking points we hear from DTC founders to clear up any confusion and get you moving forward.
What Is a Good Customer Churn Rate for a Shopify Store?
Honestly, there’s no single magic number. Benchmarks are all over the place.
For subscription-based brands, a monthly churn rate between 5-7% is often considered a decent baseline. If you're running a non-subscription store, aiming for an annual churn rate somewhere around 20-25% is a solid goal, but don't be surprised if it's higher—that's just the nature of online retail.
But here's the thing: the most important benchmark is your own trend line. A truly healthy business isn't defined by hitting some arbitrary industry average. It's defined by consistently driving its own churn rate down over time. Focus on your own progress, not a static target.
How Do I Define a Churned Customer Without Subscriptions?
This is the big one for most Shopify stores. The most reliable way to handle this is by defining churn based on purchase inactivity. You have to dig into your own data to get this right.
Look at your historical customer data and figure out the average time between a customer's first and second purchase. Once you have that number, you have a baseline.
If a customer sails past that timeframe without buying again—say, twice the average—it's pretty safe to consider them churned. This approach gives you a definition backed by your own business data, which is far more accurate than just taking a guess. Our guide on the customer retention rate calculation dives deeper into this if you want more context.
Should I Include Involuntary Churn From Failed Payments?
Yes, but you absolutely have to track it separately from voluntary churn (when someone actively cancels). If you lump them together, you’re muddying the waters and hiding crucial insights.
Think of it this way:
- Involuntary Churn usually points to an operational snag. Think issues with your payment processor or dunning emails that aren't landing.
- Voluntary Churn signals a more fundamental problem with your product, pricing, or the overall customer experience.
By calculating them separately, you can attack the right problem. Fixing failed payments is a totally different—and often much easier—challenge than rethinking your core product-market fit.
Can I Calculate Churn for Specific Products or Campaigns?
Not only can you, but you should. This is the moment when churn calculation goes from being a simple health metric to a real strategic weapon. When you start segmenting your churn analysis, you uncover incredibly powerful growth levers.
For example, calculating churn just for customers whose first purchase was "Product X" might reveal a quality issue or a terrible post-purchase experience tied to that specific item.
Or, you could calculate churn for a cohort you acquired from a specific ad campaign. That might tell you if you're just attracting low-quality, one-and-done buyers. This kind of granular analysis is how you start optimizing everything from product development to ad spend.
The first step to lowering your churn is getting a clear, reliable number. Stop wrestling with spreadsheets and get automated, actionable churn insights instead. MetricMosaic connects your Shopify and marketing data to give you a real-time view of your retention health, so you can focus on growing your brand. Start your free trial today and turn your churn data into your biggest growth advantage.