How to Master Customer Retention Rate Calculation on Shopify
Unlock growth with our guide to customer retention rate calculation. Learn the formulas Shopify founders use to boost LTV and profitability with AI analytics.
You're checking your Shopify dashboard daily, watching sales roll in. You're pouring money into Meta ads, celebrating every new customer. But behind the scenes, a nagging question lingers: are these customers actually sticking around? For many Shopify and DTC founders, the data is a mess of fragmented reports from Shopify, Google Analytics, and Klaviyo, making it nearly impossible to know if you're building a loyal customer base or just running on a customer acquisition treadmill.
Figuring out your customer retention rate is the first real step toward building a more profitable DTC brand. It’s a straightforward formula that shows you the percentage of existing customers you hang onto over a certain period—say, a month or a quarter—while ignoring all the new ones you just brought in. This one number tells you how "sticky" your brand is. For any Shopify store, it’s one of the most critical health indicators you can track.
Why Retention Is Your Most Powerful Growth Lever
As a Shopify founder, you’re drowning in data. You’ve got Shopify analytics, Google Analytics, Klaviyo reports, and a dozen ad dashboards all fighting for your attention. It's so easy to get obsessed with top-of-funnel metrics like ROAS and CAC, celebrating every new customer.
But focusing only on acquisition often hides a huge problem: a leaky bucket. If you're constantly pouring money into acquiring new customers just to replace the ones who are walking out the back door, you're stuck on a growth treadmill. It's expensive, and it's exhausting. True, sustainable growth isn’t just about getting more customers; it’s about keeping the ones you’ve already earned.
This is where mastering your customer retention rate calculation changes the game for your Shopify store. It pulls your focus away from expensive acquisition and toward capital-efficient growth, turning one-time buyers into loyal fans with a much higher lifetime value (LTV).
The Profitability Engine of Your DTC Brand
So why is a small bump in retention such a big deal for a DTC brand? Because repeat customers are just plain better for business. They already trust you, they don’t need a ton of marketing spend to come back, and they usually have a higher average order value (AOV). This creates a powerful compounding effect on your bottom line and profitability.
A classic insight that’s more relevant than ever is how much small retention gains can move the needle. A tiny 5% increase in customer retention can boost profits by up to 100%. That incredible leverage comes from the simple fact that repeat buyers often spend 67% more than first-time shoppers. It's a flywheel of profitability. You can dig into more of these impactful retention statistics to see the full picture.
For a growing Shopify brand, shifting just 10% of your focus from acquisition to retention can have a more significant impact on your LTV and net profit than doubling your ad spend. It's the smartest, most direct path to building a resilient business.
Ultimately, your retention rate is more than a number—it’s a direct reflection of the value people find in your products and your brand. A high retention rate signals you’ve found a strong product-market fit and have a healthy relationship with your customers. A low one is an early warning that something’s broken in the post-purchase journey. By learning how to calculate, track, and improve it, you stop putting out fires and start building proactive, data-driven growth.
The Essential Formulas for Calculating Retention
You don't need a Ph.D. in data science to get a grip on your customer retention. For a busy Shopify founder, it's all about picking the right formula to answer a specific question. Let's walk through the three most important methods, starting with a quick snapshot and moving to the kind of deep analysis that actually drives decisions.
This decision tree nails a core strategic choice for DTC brands: focusing on retention is a direct path to better profitability.
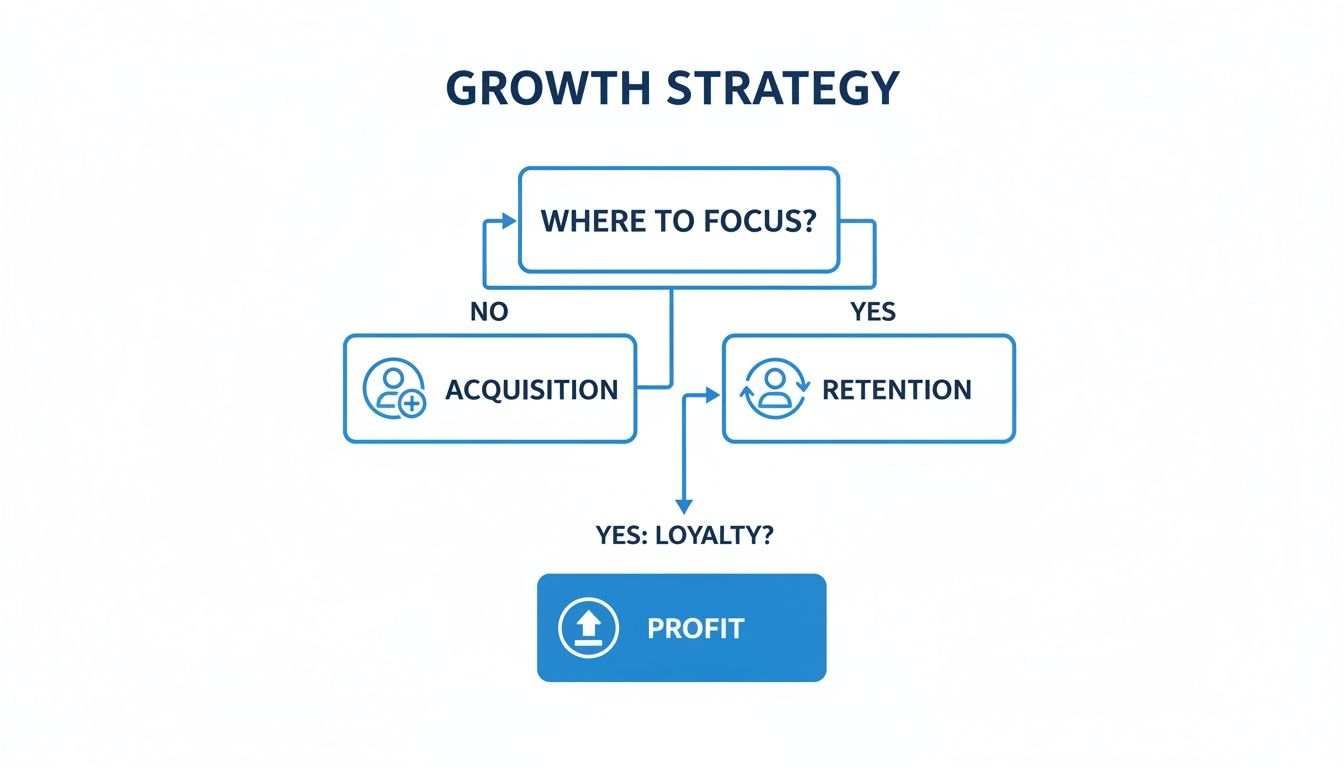
As the visual shows, while acquisition is about getting new people in the door, the real, sustainable profit is made by keeping them around.
The Simple Retention Rate Formula
Think of this as your go-to for a quick health check. It gives you a single percentage that shows how many customers you held onto over a set period, like a month or a quarter. It's perfect for spotting big swings in loyalty at a glance.
The formula itself is pretty straightforward:
Retention Rate = [ (Customers at End of Period - New Customers Acquired) / Customers at Start of Period ] x 100
Let's say you run a DTC coffee subscription box and want to check your Q1 retention.
- Customers at Start (S): You had 1,000 customers on January 1st.
- Customers at End (E): By March 31st, you had 1,050 customers.
- New Customers (N): You brought in 200 new subscribers during Q1.
Plug those numbers into the formula:[ (1,050 - 200) / 1,000 ] x 100 = 85%
Your Q1 retention rate is 85%. Simple. It means of the people who started the quarter with you, 85% of them were still active customers at the end.
The Rolling Retention Rate
This one is particularly handy for subscription businesses or any brand where repeat buys are frequent. Unlike the simple formula, rolling retention tracks the percentage of customers who made at least one more purchase within a specific window after their last one.
It helps you get a feel for your natural buying cycle. For example, you could calculate a 30-day rolling retention to see how many people come back within a month. It’s a powerful way to see if your customers are staying engaged.
The Cohort Retention Rate
Now we're getting to the good stuff. This is where the real, actionable insights are hiding. A cohort is just a group of customers who share a common starting point—usually the month they made their first purchase. Cohort analysis tracks how these specific groups behave over time.
Instead of one blended number, you get a detailed grid that shows how each group's loyalty changes month after month. This is the bedrock for understanding customer lifetime value (LTV) and seeing if your marketing is actually working long-term. It answers the questions that matter:
- Did the customers we got during Black Friday stick around longer than the ones from our Valentine's Day sale?
- Is retention for customers acquired through our TikTok campaigns getting better over time?
- Are people who buy our new skincare line more loyal than those who just buy our classic products?
You could build a cohort analysis in a spreadsheet, but it's a massive headache and incredibly easy to mess up. If you really want to go down that rabbit hole, here's a complete guide on customer retention rate calculation that breaks down the mechanics.
Honestly, though, this is exactly where AI-powered analytics tools were built to replace manual data crunching. By connecting directly to your Shopify and marketing data, they build these cohort tables for you automatically, saving you from spreadsheet hell and surfacing the important takeaways instantly.
Ultimately, the right formula depends on the question you're asking. For a quick pulse check, the simple formula is fine. But for a deep understanding of customer behavior that you can build a strategy on, cohort analysis is the gold standard for any serious DTC brand.
How AI Automates Your Retention Analysis
If you've ever tried to calculate customer retention rate yourself, you know the pain. It's a brutal, soul-crushing time-sink, especially for a busy Shopify founder. You spend hours wrestling with CSV exports from Shopify, Klaviyo, and Google Analytics, trying to stitch them together with VLOOKUPs and pivot tables just to build a single cohort chart.
By the time you get a number, the data is already stale. And the risk of one tiny copy-paste error throwing off your entire analysis? It’s painfully high. This manual grind isn't just annoying; it’s a genuine barrier to growth. It keeps you stuck in the weeds, looking backward at what happened instead of focusing on why it happened and what you can do about it.

This is exactly where modern, AI-powered analytics platforms like MetricMosaic completely change the game. Instead of you pulling the data, the platform does it for you by connecting directly to your entire tech stack, transforming complexity into clarity.
From Manual Spreadsheets to Automated Insights
An AI analytics co-pilot is built to do the heavy lifting. It automatically handles the data integration and number-crunching by plugging into your Shopify store, your email platform like Klaviyo, and your analytics tools like GA4. The result is a single, unified view of your business that’s always up-to-date.
Your cohort analysis is suddenly live. No more manual exports. No more double-checking formulas. The platform automatically groups customers into cohorts by their first purchase date and tracks their repeat buying behavior over time. It then turns that complex spreadsheet into a clear, color-coded retention table you can understand at a glance.
Imagine logging in and instantly seeing a predictive insight that your 6-month retention for customers acquired from Meta ads is 15% higher than for those from Google. That’s not a report you spent a day building; it’s an insight that’s just waiting for you, telling you where to invest your ad budget for better LTV.
This kind of automation frees you from the mechanics of the calculation and lets you get straight to the strategy. You can immediately spot trends, like whether retention is improving month-over-month or if a specific cohort is churning way faster than others.
Uncovering the Story in Your Data
But a great AI platform does more than just automate calculations—it finds the story buried in the numbers. It translates the raw data into a narrative you can actually act on, surfacing proactive, story-driven data insights that shine a light on your biggest opportunities and risks.
An AI engine can analyze all that unified data and spot patterns a human would never catch. For example, it might discover that:
- Customers who buy a specific "gateway" product have a 30% higher LTV and should be the focus of your top-of-funnel campaigns.
- Your brand has a massive drop-off between the first and second purchase, pointing to a weakness in your post-purchase onboarding flow.
- A recent change to your shipping policy perfectly coincided with a 5% dip in 30-day retention for customers in the Midwest.
These aren't just random data points. They are clear, story-driven insights that tell you what to do next. The AI connects the dots between your marketing, your sales data, and actual customer behavior, telling you not just what your retention rate is, but why.
Conversational Analytics: The End of Reports
The next leap forward is moving beyond dashboards entirely. With conversational analytics, you can just ask questions in plain English and get answers instantly. For busy DTC operators who don't have time to moonlight as data analysts, this is a massive advantage.
Instead of messing with filters and building reports, you can just ask your data co-pilot:
- "Show me my 3-month retention for customers from our TikTok campaign in Q2."
- "What's the average LTV of customers who first bought our best-selling coffee blend?"
- "Compare the retention of subscribers who joined in May versus June."
This transforms your data from a static spreadsheet into a dynamic conversation. You can test a hypothesis on the fly, drill down into an interesting trend without building a new report, and get the exact answer you need in seconds. For a modern Shopify brand, that kind of speed isn't a luxury—it's a serious competitive edge.
What Is a Good Retention Rate for a Shopify Store
So you’ve run the numbers. Maybe you even used an AI-powered tool like MetricMosaic to automate your customer retention rate calculation, and now you have a percentage staring you in the face. This leads to the million-dollar question every Shopify founder asks: "Is this number actually good?"
The honest answer? It depends. There’s no magic number for a "good" retention rate. It's a moving target, heavily influenced by your industry, how long you've been in business, and even your average order value. Context is everything here.
Benchmarks Across Different Industries
Trying to compare your DTC apparel brand to a SaaS company is like comparing apples to oranges. Their business models, customer expectations, and buying cycles are worlds apart, which naturally creates completely different loyalty patterns.
This is where industry benchmarks give you some much-needed perspective. For example, media and professional services often boast an impressive 84% annual retention rate, mostly because they run on subscriptions and have high switching costs. At the other end of the spectrum, you have hospitality and travel businesses hovering around 55%.
And where does eCommerce land? Typically, around 38% annually. You can dig into more of these numbers in the latest customer retention rate statistics. This data shines a light on a critical reality for Shopify brands: you're fighting in a crowded space where customer loyalty is incredibly hard to earn. That 38% might look low at first, but for a typical DTC brand, it's right in line with the average.
To help you get a clearer picture of where you stand, here’s a look at some common retention benchmarks across different DTC sectors.
DTC Retention Benchmarks by Industry
This table breaks down average retention rates across key DTC verticals. Use it to gauge how your store’s performance stacks up against others in your specific niche.
| Industry Vertical | Average 3-Month Retention | Average Annual Retention |
|---|---|---|
| Food & Beverage | 35% - 45% | 40% - 50% |
| Supplements & Wellness | 30% - 40% | 35% - 45% |
| Beauty & Skincare | 25% - 35% | 30% - 40% |
| Apparel & Fashion | 20% - 30% | 25% - 35% |
| Home Goods & Decor | 15% - 25% | 20% - 30% |
| Pet Supplies | 25% - 35% | 30% - 40% |
| Electronics & Accessories | 10% - 20% | 15% - 25% |
Remember, these are just averages. Top-performing brands often exceed these figures, but they provide a solid starting point for setting your own goals.
What Good Looks Like for Your DTC Brand
Instead of getting fixated on a single industry number, a healthier approach is to benchmark against your direct vertical and, more importantly, your own past performance. A "good" retention rate is one that’s consistently getting better.
Here’s a simple framework for setting realistic goals based on where your Shopify brand is today:
Early-Stage Brand (First 1-2 Years): You're all about finding product-market fit. A "good" rate here might just be seeing a steady group of your first 100 customers coming back. Keep your eye on the 3-month retention rate. If you can get 20-25% of new customers to make a second purchase within a quarter, you're building a fantastic foundation.
Growth-Stage Brand (Scaling): You have a solid customer base and you're focused on maximizing LTV. Now, you should be aiming for an annual retention rate of 35% or higher. The best Shopify stores in this stage often push past 40% by nailing their post-purchase experience and loyalty programs.
Mature Brand (Established Leader): You're a well-known name in your niche. The game shifts to defending market share and squeezing out more profitability. A good retention rate is anything above 45%, and even small, incremental gains are celebrated as huge wins.
Your real goal isn't just to meet an industry average; it's to outperform your past self. If your 6-month cohort retention was 18% last year and it's 22% this year, that's a significant victory.
Factors That Shape Your Target Retention Rate
Beyond industry and growth stage, a few other factors will influence what you should be aiming for. Keeping these in mind will help you set smarter, more attainable goals.
Product Category: Consumable products—think coffee, supplements, or skincare—naturally have higher retention potential because they have a built-in repeat purchase cycle. Brands selling durable goods like furniture or high-end electronics will inherently have lower repeat rates and should focus more on LTV over a much longer time horizon.
Average Order Value (AOV): Brands with a high AOV might see lower retention rates, but they can still have a massive LTV from just a few repeat purchases. On the flip side, brands with a low AOV need a higher retention rate to build a profitable business.
Customer Lifecycle: How long does it usually take for a customer to need your product again? A razor subscription brand might have a 30-day cycle, while a fashion brand might see customers return every 90 days. Your retention targets have to align with these natural buying rhythms.
Ultimately, a good retention rate for your Shopify store is a data-informed target that reflects your unique business. It’s a number you can actually influence and one that directly fuels your long-term, profitable growth.
Actionable Strategies to Improve Your Retention Rate
Alright, you've calculated your customer retention rate. It’s like stepping on the scale—the number itself doesn't move the needle. The real work starts now, turning that number into a story of growth and profitability.
For Shopify brands, this means getting past the generic advice. It’s time to dig into practical, data-driven takeaways that directly address why customers are leaving and what will actually convince them to stay.
Boosting retention isn’t about one big, grand gesture. It’s about a series of smart, targeted moves, all informed by the very cohort data we’ve been talking about.
Identify and Nurture Your Best Customers
Think of your cohort analysis as a treasure map. It points you straight to your most valuable customers—the ones who stick around the longest and spend the most. These are the people your brand truly clicks with, and they deserve some special attention.
Start by looking at the behavior of your top-performing cohorts. What was their first purchase? Which marketing channel brought them to you? AI-powered tools can surface these patterns for you automatically, revealing gems like how customers who first bought your "Discovery Kit," for example, have a 40% higher 6-month retention rate.
Once you have that insight, you can act on it:
- Segment your VIPs: Jump into Klaviyo and create an exclusive segment for customers with 3+ purchases or an LTV above a certain dollar amount.
- Offer exclusive perks: Give them early access to new product drops, surprise them with a free gift in their next order, or invite them to see exclusive content.
- Build a community: Start a private Slack channel or Facebook group where they can connect with your team and other loyal fans.
This isn't just about handing out rewards. It’s about making your best customers feel like insiders, which builds a much deeper sense of loyalty than a simple discount ever could.
Supercharge Your Post-Purchase Experience
The moments right after a customer clicks "buy" are your single biggest retention opportunity. Their excitement is at a peak, but so is their potential for buyer's remorse. A well-crafted post-purchase email flow can bridge that gap and pave the way for a second purchase.
Don't just settle for a generic order confirmation. Design a sequence that actually adds value.
- Order Confirmation: Start with a personal thank you, maybe from the founder, and be crystal clear about shipping expectations.
- Product Education: A few days later, send an email with tips on how to get the most out of their new product. Think video tutorials, user guides, or styling ideas.
- Customer Story: Reinforce their purchase decision by sharing a powerful testimonial or some user-generated content featuring the product they just bought. It’s all about social proof.
- The Gentle Nudge: Around the 30-day mark (or whatever your typical reorder cycle is), send a check-in email that subtly suggests a refill or a complementary product.
Every email in this flow is a chance to build a relationship, not just process a transaction. This kind of proactive communication shows you care about their experience long after the sale is complete.
Implement a Loyalty Program That Works
For DTC brands fighting for repeat business, loyalty programs are no longer a "nice-to-have." They are a retention powerhouse. In fact, 59% of sales leaders see them as their most effective retention tool. You see it with giants like Starbucks, which generates a staggering 60% of its revenue from Rewards members.
A great loyalty program isn't just a glorified discount card. It's a system that makes customers feel valued and gives them a compelling reason to choose you over a competitor, every single time.
To make your program truly effective, think beyond a simple points-for-purchase model. Consider a tiered system where the rewards get better as customers spend more. Offer non-monetary perks like free shipping, priority customer support, or anniversary gifts. For a deeper dive, check out these 10 Proven Customer Retention Strategies to Maximize LTV.
The key is making the rewards feel both achievable and genuinely desirable. When you get it right, a loyalty program creates a powerful psychological barrier that stops your customers from even looking elsewhere.
Act on Customer Feedback to Refine Your Offer
Finally, one of the most direct ways to improve retention is simply to listen to your customers. Your churned customers, in particular, are an incredible source of unfiltered, honest feedback.
Use your data to pinpoint customers who made one purchase and never returned. Send them a simple, one-question survey: "What was the main reason you haven't shopped with us again?" A small gift card can work wonders for response rates. The insights you get back—whether about product quality, shipping times, or pricing—are pure gold.
Use this feedback to make real, tangible improvements. If multiple people mention your product instructions are confusing, rewrite them. If shipping delays are a common complaint, it’s time to have a serious talk with your fulfillment partner. Closing these feedback loops shows customers you're listening and are committed to getting better, which can win back trust and even reactivate dormant accounts.
Common Questions About Customer Retention
Once you get the hang of the basic retention formulas, a few practical questions almost always come up. I've heard these from hundreds of Shopify founders over the years, so let's clear them up right now.
How Often Should I Be Looking at This?
For most stores, there’s a sweet spot. You’ll want to calculate your retention rate both monthly and quarterly.
Think of your monthly calculation as your tactical, short-term radar. It’s perfect for seeing the immediate ripple effects of your latest marketing moves—like a new Klaviyo flow or that flash sale you ran last weekend.
Your quarterly view is more strategic. It smooths out the inevitable bumps and dips of any single month, giving you a much steadier read on long-term loyalty and the overall health of your business.
Annual reports? They’re fine for high-level investor updates, but honestly, the data is too stale to be actionable. If you wait for an annual report to spot a retention problem, you've already lost a year of opportunities to fix it.
What’s the Real Difference Between Retention Rate and Churn Rate?
This is a great question. They’re basically two sides of the same coin, but they tell a slightly different story.
- Customer Retention Rate is the percentage of customers you hang onto.
- Customer Churn Rate is the percentage of customers you lose.
So, if your retention rate is 85%, your churn rate is simply 15%. The math is dead simple. The difference is psychological.
Focusing on "improving retention" puts your team in a proactive, positive headspace. It’s about building loyalty and enhancing the customer experience. Talking about "reducing churn," on the other hand, often feels reactive—like you're just trying to stop the bleeding.
Can I Calculate Retention for Specific Products or Channels?
Absolutely—and you have to. This is where you graduate from basic reporting to real strategy. It's also where modern AI-powered analytics tools can do the heavy lifting for you.
Instead of looking at one blended rate for your whole business, you can start asking much smarter questions by segmenting your cohorts. For example, you could analyze the retention of:
- Customers whose first purchase was your best-selling skincare set.
- Customers who found you through a TikTok ad last quarter.
- First-time buyers who used that 20% off welcome code.
This is how you discover which products create true fans and which marketing channels are actually bringing in valuable, long-term customers. It’s the key to optimizing your ad spend for LTV, not just a one-and-done sale.
How Do One-Time Buyers Mess with My Retention Rate?
They have a huge impact. In any standard retention formula, a customer who buys just once and doesn't come back in the next period is counted as "churned." If you have a lot of them, they will seriously drag down your overall rate.
This is why one of the single biggest goals for any DTC brand is turning those one-time buyers into repeat purchasers. Digging into the behavior of your one-and-dones versus your multi-purchase customers is one of the most powerful things you can do. It shines a light on friction points in your customer journey and shows you exactly where to improve that all-important post-purchase experience.
Your next step is to move from awareness to action. Stop wrestling with spreadsheets and get automated, story-driven insights that actually grow your Shopify store. MetricMosaic connects to your entire tech stack, turning complex data into clear actions.
Start your free trial today and see what your data is trying to tell you.