Customer Retention Metrics: The Shopify Founder's Guide to Sustainable Growth
Use customer retention metrics to fuel growth. Learn LTV, churn, and repeat purchases to boost Shopify profitability.
Think of customer retention metrics as the vital signs for your Shopify store. They're the numbers that tell you if you're building a brand people love and come back to, or if you're just a revolving door for one-time buyers. These KPIs measure your ability to keep customers happy and engaged long after that first purchase.
Why Your Shopify Store Is Leaking Revenue
If you’re a Shopify founder, this probably sounds familiar. You get a nice sales bump from a new ad campaign, but the high never lasts. Profitable, sustainable growth always seems just over the horizon. You’re in a constant grind, pouring money into Meta and Google ads, but the second you ease off the pedal, your revenue chart goes flat.
This is the classic "leaky bucket" problem, and it's a soul-crushing cycle for way too many DTC brands.
You're busy pouring new customers into the top of the bucket, but they're quietly slipping out through holes in the bottom. And you have no idea where the leaks are coming from. The problem isn't your product—it's that your data is scattered everywhere, telling you bits and pieces of the story but never the whole thing.
The Challenge of Fragmented Data
For most DTC operators, a typical day means jumping between a half-dozen different dashboards that don't speak the same language. This creates a massive blind spot right where your growth strategy should be.
- Shopify Analytics: This tells you what you sold. You can see top-line revenue and sales data, but not much else.
- Google Analytics (GA4): This tracks your traffic and tells you how people found you. It’s all about on-site behavior.
- Klaviyo (or your ESP): This shows you email engagement—open rates, clicks, and campaign performance. You know if they saw your message.
But none of these tools connect the dots for you. You're left staring at fragmented reports, trying to answer critical questions with no real answers. Why did that group of holiday shoppers never buy from you again? Which marketing channel actually delivers customers with a higher LTV?
The real cost here isn't just the hours you waste wrestling with spreadsheets. It’s the missed opportunity to truly understand your customers and make decisions that build long-term value, not just short-term revenue spikes.
From Complexity to Clarity with AI
The answer isn't just to spend more on ads. It's to finally get a grip on your customer retention metrics. This is where a new wave of AI-powered analytics platforms like MetricMosaic completely changes the game for Shopify brands.
Instead of you manually exporting CSVs and trying to stitch them together, these next-gen tools do the heavy lifting for you. They automatically connect your scattered data sources, turning a chaotic mess of numbers into a clear, story-driven narrative. Suddenly, you can see the why behind your customers' actions. You can pinpoint what inspires loyalty and what's causing people to churn. This is the clarity you need to finally plug the leaks in your bucket and start building a more resilient, profitable DTC brand.
The Core Metrics for Customer Retention
To build a brand that lasts, you have to look beyond surface-level numbers like daily revenue. The real story of your business's health isn't in one-off sales—it's in your customer relationships. The key is mastering a few essential customer retention metrics.
Think of them as a financial EKG for your brand. They measure the pulse of your customer loyalty and tell you if you're building a sustainable, long-term asset or just chasing the next transaction.
This is especially true when your data is all over the place. For most Shopify founders, trying to piece together a clear picture from different platforms feels like an impossible puzzle.
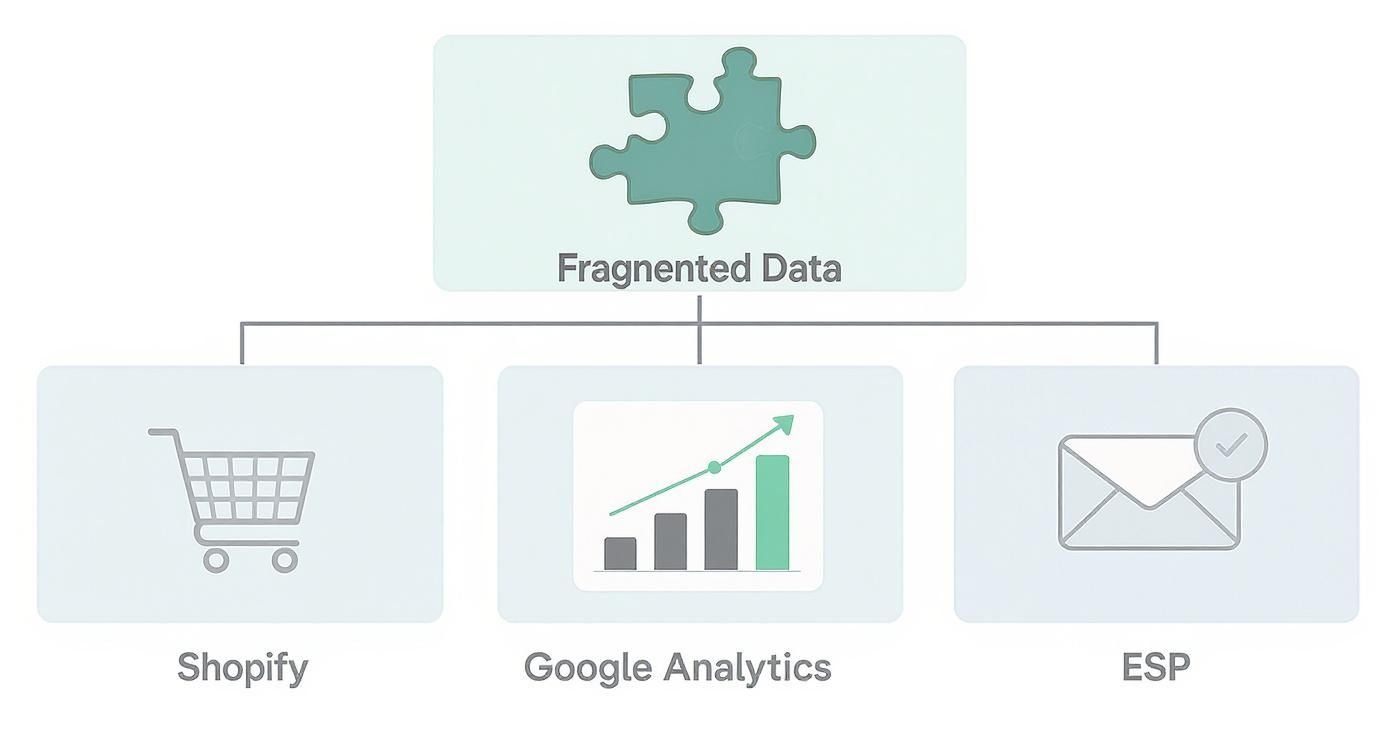
As the infographic shows, your Shopify data tells one story, Google Analytics another, and your ESP like Klaviyo a third. They all live in their own little silos, which makes getting a unified view of the customer journey a nightmare.
Without the right AI tools, calculating even the most basic retention numbers becomes a manual, error-prone mess. So, let’s cut through the noise and break down the three metrics that form the bedrock of any real growth strategy.
To make this easier, here's a quick-reference table that lays out the core metrics we're about to cover. Think of it as your cheat sheet for understanding what matters most.
Essential Customer Retention Metrics at a Glance
| Metric | What It Measures | Why It's Important for Your Shopify Store |
|---|---|---|
| Customer Retention Rate | The percentage of customers who stick around over time. | The ultimate health check for customer loyalty and satisfaction. |
| Customer Churn Rate | The percentage of customers who leave or stop buying. | Your early warning system for problems in the customer experience. |
| Customer Lifetime Value | The total revenue you can expect from a single customer. | The north star for profitable marketing (CAC) and long-term planning. |
Now that you have the big picture, let's dive into how you can calculate and use each of these to your advantage.
Customer Retention Rate (CRR)
Your Customer Retention Rate (CRR) is the most straightforward measure of loyalty you have. It answers a simple question: what percentage of our customers stayed with us over a certain period? It's the direct opposite of churn and one of the best signs that your brand and products are hitting the mark.
Calculating it isn't complicated.
CRR Formula:
[ (Customers at End of Period - New Customers Acquired) / Customers at Start of Period ] x 100
Let's put it into practice. Say you started the quarter with 1,000 customers, ended with 1,200, and brought in 300 new ones. Your retention rate would be 90%. That’s a fantastic signal. It means you held onto nine out of every ten existing customers, proving your experience is resonating.
Customer Churn Rate
While CRR tracks who stays, your Churn Rate tells you who leaves. It’s the percentage of customers who stopped buying from you in a given timeframe. For subscription businesses on Shopify, this is obviously make-or-break, but it's just as vital for every DTC store to watch.
A high churn rate is a massive red flag. It’s telling you something is broken—it could be product quality, a frustrating shipping experience, or just radio silence after their first purchase.
Here’s the simple math:
Churn Rate Formula:
( Lost Customers / Total Customers at Start of Period ) x 100
So, if you began the month with 1,000 customers and 50 of them didn't come back, your churn rate is 5%. Keeping an eye on this number helps you catch problems before they become crises that drain your revenue.
Customer Lifetime Value (LTV)
This is the big one. Customer Lifetime Value (LTV) is the metric that truly gets to the heart of profitability. It’s a prediction of the total revenue your brand can expect from a single customer over the entire course of their relationship with you.
LTV forces you to shift your mindset from short-term transactions to long-term value. It helps answer the most critical question for sustainable growth: how much is a customer really worth to us? When you know your LTV, you can make much smarter decisions about how much you're willing to spend to acquire a new one (your Customer Acquisition Cost, or CAC).
There are complex ways to figure it out, but a simple formula gets you in the ballpark:
LTV Formula:
Average Purchase Value x Average Purchase Frequency x Average Customer Lifespan
Imagine your typical customer spends $75 per order, buys three times a year, and sticks around for two years. Their LTV is $450. This number is your compass, guiding everything from your ad budget to your retention strategy.
Uncovering Deeper Insights with Advanced KPIs
Once you’ve got a handle on your core retention numbers, it's time to dig deeper and ask the most important question: Why?
Why do some customers come back for more while others disappear? Why did the group you acquired on Black Friday stick around longer than the ones from your summer sale? This is the shift from just knowing your numbers to truly understanding the behaviors that drive them. Advanced customer retention metrics are the magnifying glass that reveals the subtle habits separating your best customers from the rest.
For any Shopify founder, this is how you graduate from reactive reporting to building a proactive growth machine. These KPIs pinpoint exactly what’s working in your customer journey so you can double down on it.

From One-Off Sales to Lasting Habits
Let's start with three metrics that, together, paint a detailed picture of your customers' buying behavior.
Repeat Purchase Rate (RPR): This is as straightforward as it gets—what percentage of your customers have bought more than once? It’s a direct signal of product-market fit and the first real sign of a healthy, loyal customer base.
Purchase Frequency (PF): This metric tells you how often a customer buys from you over a specific period. It answers the question, "How many times does a typical customer shop with us in a year?"
Average Order Value (AOV): Often thought of as just a sales metric, AOV is absolutely critical for retention. It shows how much customers are spending each time they check out. Getting your repeat buyers to spend more per order is one of the fastest ways to boost profitability.
When you see a high RPR combined with a rising PF and AOV, you've hit the trifecta. That’s the dream for every DTC brand.
The Power of Cohort Analysis
This is where your analytics start to get really powerful. A cohort analysis groups customers based on a shared trait—usually the month they made their first purchase. Instead of looking at your entire customer base as one giant, anonymous blob, you can track the behavior of these smaller, specific groups over time.
Imagine you ran a big influencer campaign in March. By creating a "March New Customer" cohort, you can see if those customers delivered a higher LTV, had a better repeat purchase rate, or churned less than the customers you brought in through paid search in April. This isolates the true impact of your marketing and shows you which channels bring in the best customers, not just the most.
Manually building cohort reports from Shopify exports is a nightmare of pivot tables and VLOOKUPs. This is an area where AI-powered analytics tools provide immediate value, automatically segmenting and visualizing cohort performance to show you trends you’d otherwise miss.
Listening to Your Customers with NPS
Transactional data tells you what your customers do, but you also need to understand how they feel. The Net Promoter Score (NPS) is a brilliantly simple metric for measuring customer sentiment and loyalty. It all comes from a single question: "On a scale of 0-10, how likely are you to recommend our brand to a friend?"
- Promoters (9-10): These are your brand evangelists. They drive word-of-mouth and organic growth.
- Passives (7-8): They're satisfied but not passionate. They can easily be swayed by a competitor's offer.
- Detractors (0-6): These are unhappy customers who can actively harm your brand with negative reviews.
Tracking your NPS over time acts as a crucial early-warning system. A dip in your score often signals a rise in churn is on the horizon, giving you a chance to fix problems before they hit your bottom line.
The Final Frontier: Predictive Analytics
The most sophisticated Shopify brands are no longer just looking at what happened in the past; they’re starting to predict the future. This is where predictive metrics like churn propensity come into play.
Modern AI analytics platforms can analyze thousands of data points—from purchase history and email engagement on Klaviyo to on-site behavior in Google Analytics 4—to calculate the probability that a specific customer is about to leave. This lets you switch from a reactive "win-back" strategy to a proactive retention plan. Instead of sending a desperate discount after they've gone quiet, you can intervene with a personalized offer or support outreach while they're still engaged. This next-gen trend, often part of conversational analytics, is how you stay ahead of the curve.
This forward-looking approach is a true competitive advantage, turning your historical data into a roadmap for future growth. It's no surprise the global loyalty management market was valued at $13.31 billion in 2024 and is projected to hit $41.21 billion by 2032. With 67% of companies planning to increase their retention spending, leveraging predictive analytics is how you stay ahead of the curve. You can discover more insights about the growing importance of loyalty programs and see how top brands are investing in their futures.
How to Track Metrics in Your Shopify Ecosystem
Knowing which customer retention metrics to track is one thing. Actually measuring them without getting lost in a sea of spreadsheets is the real challenge for most Shopify founders. Let’s look at how you can pull this data from the tools you’re already using—and be honest about the headaches involved.
This whole process can feel like trying to solve a puzzle in the dark. You’ve got pieces of the customer story scattered across different platforms, and it’s up to you to stitch them together into something that actually makes sense.
Using Native Shopify Reports
Your Shopify admin panel is the obvious place to start. It’s the source of truth for all your sales data and has a few useful, if basic, reports built-in.
- Customer Cohort Analysis: Buried in your Analytics section, this report groups customers by the month they first bought from you and shows how many came back in the following months. It's a decent first look at whether your retention is trending up or down.
- Returning Customer Rate: This one’s simple—it just gives you a percentage of customers who've placed more than one order. It's a handy top-level stat, but it won’t tell you how often they’re buying or how much they’re spending.
- Top Customers by Spend: This report is great for identifying your VIPs, but it's purely a rearview mirror. It shows you who has spent the most, not who’s likely to keep spending.
These native reports give you a snapshot, but they don't have the depth you need to build a real retention strategy. They don't connect the dots between your marketing efforts and long-term value, leaving you guessing which campaigns are actually driving profitable growth.
Estimating Behavior with Your Email Platform
Your email service provider—whether it's Klaviyo, Omnisend, or something else—is sitting on a goldmine of behavioral data. By getting clever with customer segments, you can start to paint a clearer picture of buying habits.
For instance, in Klaviyo, you can build segments to get a rough estimate of your Repeat Purchase Rate (RPR) and Purchase Frequency (PF).
- Segment for Repeat Buyers: Create a segment of customers where "Placed Order is at least 2 over all time." The number of people in this list divided by your total customer count gives you a ballpark RPR.
- Segment for Frequent Buyers: Build another segment for customers where "Placed Order is at least 3 in the last 365 days." This helps you spot customers with a higher-than-average purchase frequency.
This method is a step up from Shopify alone, but it’s still just an estimate. You have to constantly build and update these segments, and it doesn't really help you calculate the actual lifetime value (LTV) of these groups.
The Manual Grind and Its Hidden Costs
So yes, you can track these metrics with your existing tools. But the reality for most founders is a painful cycle of exporting CSV files from Shopify, Google Analytics 4, and their ESP, then trying to mash them all together in a monster spreadsheet.
This isn't just a technical problem; it's a strategic one. Every hour you spend wrestling with VLOOKUPs and pivot tables is an hour you aren't spending on marketing, product development, or actually talking to your customers. The risk of a mistake is huge—one bad formula can lead to costly decisions based on bad data.
This is the exact problem AI-powered analytics platforms like MetricMosaic were built to solve. Instead of you pulling data from a dozen different places, an automated platform plugs directly into your Shopify store, GA4, and marketing channels. It replaces manual data crunching with real-time, accurate insights.
It automates the heavy lifting for cohort analysis, LTV, and churn prediction in real-time. What used to take hours of data crunching becomes an instant, accurate, and story-driven dashboard. This gets you out of the spreadsheet grind and lets you focus on what the numbers actually mean—turning insights into action that grows your bottom line.
Turning Retention Data into Actionable Growth Plays
Knowing your customer retention metrics is like having a map of your business. But a map is pretty useless if you don't know how to read it. The best Shopify brands don't just stare at their numbers; they turn them into specific, actionable strategies that actually move the needle. This is where you graduate from just reporting on the past to actively shaping the future.
Your metrics are signals. They’re telling you where the customer experience is clicking and, more importantly, where it’s falling apart. The real magic happens when you connect each signal to a specific "growth play"—a targeted tactic designed to fix a leak or double down on what’s working.
Responding to a Low Repeat Purchase Rate
Let's say your data is screaming that your Repeat Purchase Rate (RPR) is in the gutter. This is a classic "leaky bucket" problem. It means your first-time buyers aren't getting a compelling reason to come back for more. Instead of throwing random discounts at the wall, you can run a targeted play.
This is the perfect moment to build a killer post-purchase flow in a tool like Klaviyo. But this isn't about sending a generic "Thanks for your order!" email. Get strategic.
- The 3-Day Check-in: Forget the sales pitch. Send a message packed with value. Think video tutorials, a quick-start guide, or tips on getting the most out of their new product.
- The 14-Day Feedback Request: Ask them for a review. You not only get powerful social proof, but you also make your customers feel like their opinion matters.
- The 30-Day Replenishment Nudge: If you sell anything consumable, this is your shot. Send a timely reminder that they might be running low, maybe with a small perk to seal the deal.
An AI analytics platform can supercharge this. Instead of a one-size-fits-all flow, story-driven insights might tell you that customers who bought Product A are extremely likely to buy Product B next. Now you can personalize that 30-day nudge with a highly relevant cross-sell, making it far more likely to convert.
Tackling High Churn Among First-Time Buyers
A high churn rate after just one purchase is a massive red flag. It’s a sign that the promise you made in your ads isn't matching the reality of the customer experience. Your mission here is to build loyalty right out of the gate.
The growth play? Design an unboxing and onboarding experience that wows them. This is about more than just putting a product in a box.
Think of the first 30 days as a critical relationship-building period. Every touchpoint is an opportunity to reinforce their decision and prove your brand's value, turning a simple transaction into the start of a loyal following.
This is where investing in the customer journey pays dividends. In fact, 44.5% of businesses now see customer experience as their main competitive advantage. When customers have an awesome first interaction, they spend 140% more on average than those who have a bad one. As you tighten up your onboarding, keep in mind that 61% of customers say they'll pay at least 5% more for a better experience. You can learn more about these customer retention statistics and see for yourself how experience directly fuels revenue.
Activating Predictive Insights to Prevent Churn
The most powerful growth plays are proactive, not reactive. This is where AI-powered analytics truly changes the game. Imagine your platform's predictive models flag a segment of high-LTV customers whose engagement has suddenly cratered—a clear indicator of high churn propensity.
The system doesn't just hand you a problem. Its conversational analytics might say, "Your top 10% of customers from the Q2 cohort are showing a 75% churn risk. They haven't opened an email in 2 weeks. A 15% discount on their previously viewed items has a high probability of re-engagement."
That insight is your growth play:
- Create a Segment: Instantly build a dynamic "At-Risk VIPs" segment in your email platform.
- Launch a Targeted Campaign: Send a personalized "We Miss You" campaign armed with the exact offer the AI recommended.
- Monitor Results: Watch the re-engagement rate and revenue from this specific play to see the impact.
This is the future of DTC. It's not about gut feelings or spending hours buried in spreadsheets. It's about using AI-driven, story-based analytics to get a clear set of instructions for growing your Shopify brand, one smart decision at a time.
Setting Realistic Goals and Avoiding Common Pitfalls
Knowing your numbers is just the first step. Context is everything.
One of the most common traps Shopify founders fall into is comparing their customer retention metrics to the wrong benchmarks. A “good” retention rate isn’t some universal number; it’s completely tied to your industry and what you sell. You just can’t expect the same kind of loyalty for a luxury jacket brand as you would for a daily supplement subscription.
When you set unrealistic goals based on bad comparisons, you’re just signing up for frustration and a strategy that’s doomed from the start. To set targets you can actually hit, you need to know where you fit in the bigger DTC picture.
Understanding Industry Benchmarks
Customer retention rates swing wildly from one industry to another. Media and professional services, for instance, often hit retention rates as high as 84%, usually because they're built on contracts and ongoing value. Then you have industries like hospitality and travel, which average around 55% because the purchases are so much more transactional.
This context is crucial for setting expectations for your own brand. A store selling consumable goods might aim for a 35%+ retention rate. But if you’re selling high-ticket items people only buy once every few years, hitting 25% could be a huge win. The real key is to benchmark against your peers and, even more importantly, against your own past performance. You can learn more about how customer retention rates differ across industries to get a better sense of where you stand.
Sidestepping Common Retention Mistakes
Even with the right benchmarks, it’s still way too easy to stumble into common traps that can throw your growth completely off course. Here are a few pitfalls to watch out for.
- Obsessing Over Vanity Metrics: Sure, watching your total customer count go up feels good. But it tells you almost nothing about the actual health of your business. A growing customer list with a tanking cohort LTV is a classic leaky bucket scenario—it’s not sustainable growth.
- Misinterpreting Churn Without Segmentation: Your overall churn rate can easily hide some serious problems. You might find that while your total churn looks stable, you're actually losing your best customers at a terrifying rate. AI-powered analytics platforms are built to surface these kinds of critical, story-driven insights automatically.
- Ignoring Leading Indicators: Don't wait until a customer is gone to do something about it. A drop in email engagement, fewer visits to your site, or a bad NPS score are all smoke signals. Predictive tools like MetricMosaic are designed to flag these at-risk customers, giving you a chance to step in before they churn for good.
Frequently Asked Questions
When you start digging into customer retention metrics, a few common questions always pop up. Let's tackle the ones we hear most from Shopify founders.
What Is a Good Customer Retention Rate for a Shopify Store?
This is the classic "it depends" question, but here's a practical breakdown. There's no single magic number because it all comes down to what you sell.
If you’re a DTC brand with consumables—think coffee, skincare, or supplements—you should be shooting for a retention rate of 35% or higher. That's a solid benchmark. But if you sell apparel or electronics where people buy less often, landing anywhere in the 25-30% range is fantastic.
Honestly, the most important benchmark is your own history. Your real goal is to see that number climbing, even if it's just a little bit, month after month. That's how you know your efforts are paying off.
How Often Should I Track These Retention Metrics?
Keep it simple: check your core customer retention metrics, like Customer Retention Rate (CRR) and Customer Lifetime Value (LTV), every month. A monthly check-in is the sweet spot—it’s frequent enough to catch trends before they become problems, but not so often that you get bogged down in daily fluctuations.
For deeper dives, like cohort analysis, a quarterly review works perfectly. This is where you can really see how customers from a specific holiday sale or marketing campaign have stuck around over time. Of course, this is where a tool that does the heavy lifting for you can change the game, giving you a real-time pulse on customer behavior so you can act fast.
Can I Calculate LTV Directly in Shopify?
Not really, and this is a big one. Shopify Analytics gives you some great basic reports, but it stops short of providing a true, predictive Customer Lifetime Value (LTV) out of the box. You can see what a customer has spent to date, but that’s looking in the rearview mirror.
To get an accurate, forward-looking LTV, you need to analyze customer cohorts. That usually means wrestling with messy CSV exports and complex spreadsheets, or plugging in a dedicated analytics platform that can do the cohort modeling for you.
Ready to stop guessing and start growing? MetricMosaic unifies all your Shopify data, transforming complex numbers into clear, actionable growth plays. See your true LTV, predict churn, and get AI-powered recommendations to boost your profitability. Start your free trial today.