How to Calculate Customer Acquisition Cost for Your Shopify Store
Learn how to calculate customer acquisition cost (CAC) accurately. This guide offers DTC brands a clear path to improve ROAS, profitability, and growth.
You’re staring at your Shopify dashboard, then flipping over to your Meta Ads manager. The numbers don't quite add up. Your ad spend is climbing, but your profitability feels… fragile. You have a rough idea of your customer acquisition cost, but if you're honest, it's mostly based on ad spend—a dangerously incomplete picture that could be hiding serious problems.
Sound familiar? This struggle is one of the most common challenges for DTC founders. Fragmented data across Shopify, ad platforms, and analytics tools makes it nearly impossible to get a clear, reliable answer to the most critical question: "What does it really cost to get a new customer?" This uncertainty is what keeps you guessing when you should be scaling.
Your Customer Acquisition Cost Is Quietly Killing Your Profits
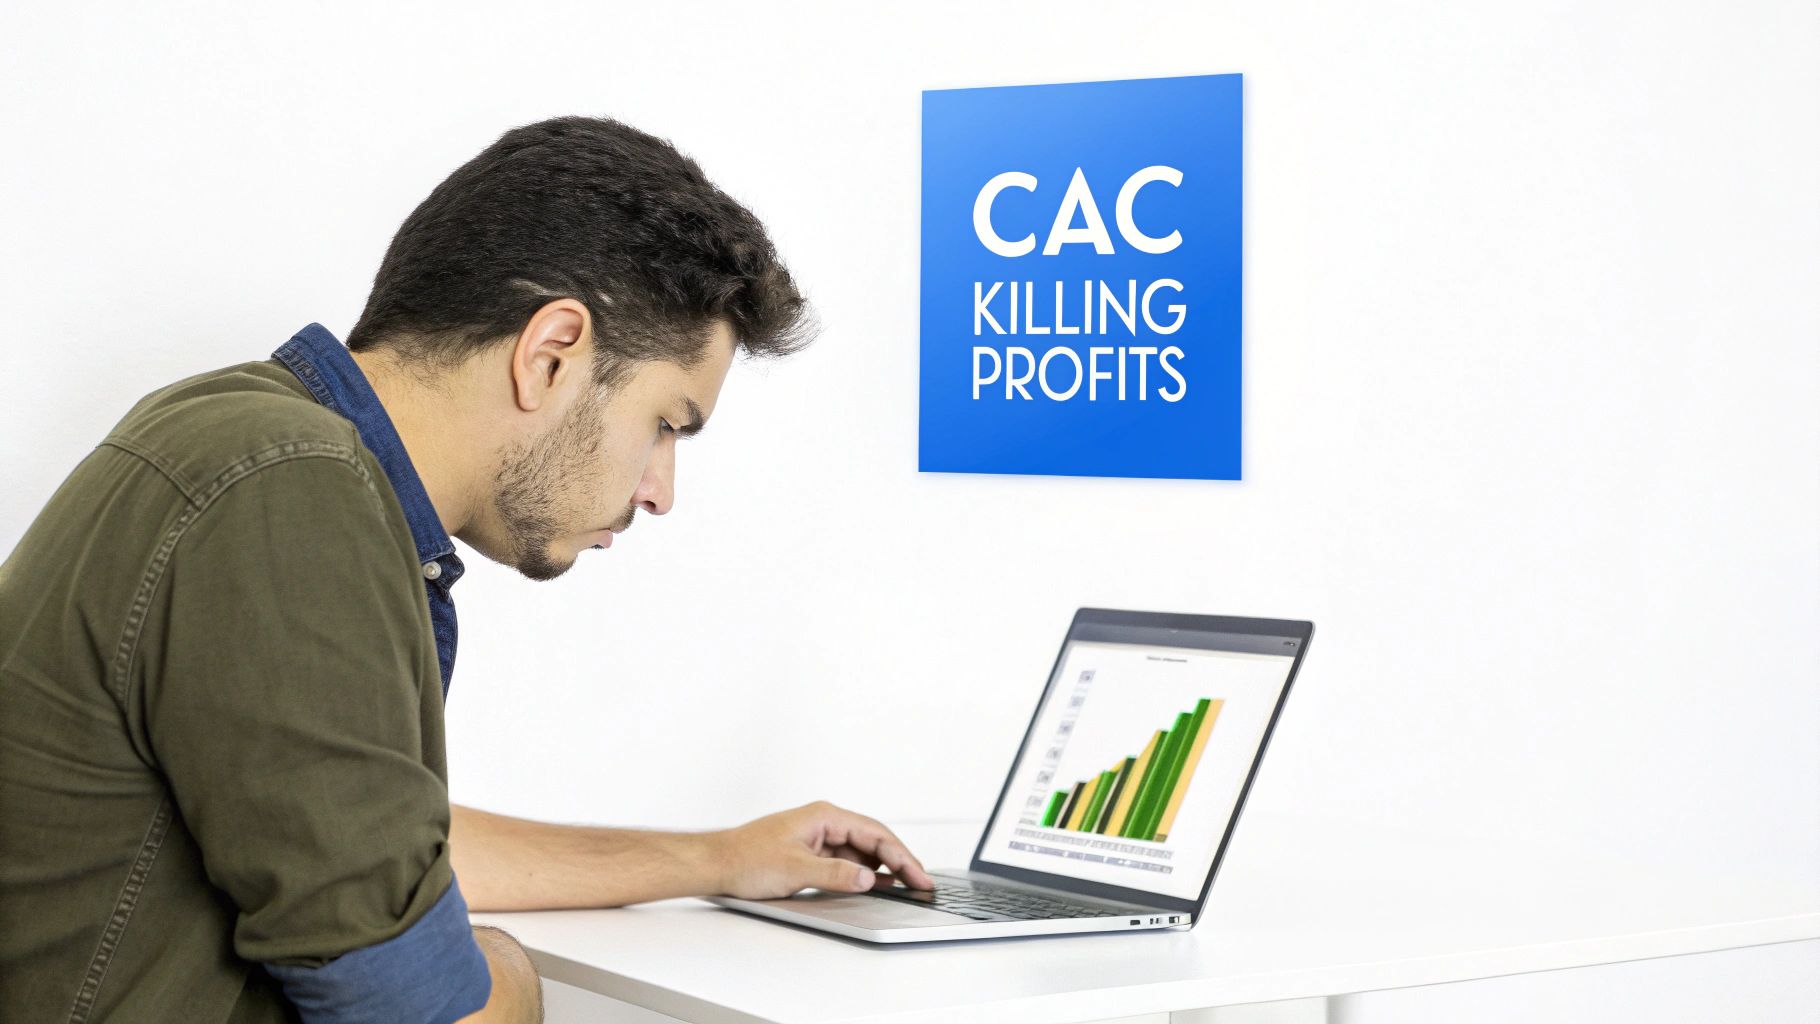
You’ve felt this firsthand. Ad costs on Meta and Google keep climbing, and it feels like your profit margins get a little thinner with every campaign you launch. You watch your Return on Ad Spend (ROAS) trend downward but can't confidently say why, or which channels to pour more money into and which to kill.
That feeling of uncertainty? It's a classic symptom of a problem that plagues DTC brands: having only a vague, surface-level grasp of your true Customer Acquisition Cost.
The Problem of Fragmented Data
At its core, the issue is fragmented data. Your ad spend lives in Meta Ads and Google Ads. Your revenue is tracked in Shopify. Your analytics are stuck in GA4. Trying to piece all of this together manually isn't just a headache; it's a recipe for expensive mistakes.
This disconnect creates hidden costs that silently eat away at your bottom line. A quick-and-dirty CAC calculation—one that only looks at ad spend—might look perfectly healthy. But it’s masking the reality that your true, fully-loaded CAC is completely unsustainable. This is how brands scale themselves straight into bankruptcy.
Key Takeaway: Relying on platform-reported ROAS and a basic CAC formula is a critical mistake. To make profitable scaling decisions, you have to understand your fully-loaded CAC, which includes all marketing-related expenses.
Moving from Guesswork to Growth
This guide is designed to solve that exact problem. We're going to give you a clear, actionable framework to calculate customer acquisition cost accurately, so you can stop guessing and start making decisions with confidence. When you know your true costs, you can finally get a real handle on your profitability and build a smarter growth strategy for your Shopify store.
Here's what we'll break down:
- How to identify all the relevant acquisition costs that go way beyond just ad spend.
- The best ways to gather data from your entire tech stack without manual data crunching.
- How to calculate CAC for different channels to find your most profitable growth levers.
- How AI-powered analytics can automate this entire process, turning complexity into clarity.
By the end, you'll have a model for calculating CAC that gives you the confidence to put your marketing dollars where they’ll actually make you money.
Defining the True Cost of Acquiring a Customer
Let's get real about what it actually costs to land a new customer. The textbook formula—Total Sales & Marketing Costs / New Customers—seems simple enough. But for any growing Shopify brand, the real danger is hiding in how you define "Total Costs."
One of the most common traps I see DTC founders fall into is only tracking direct ad spend from platforms like Meta or Google. This is a huge mistake. It paints a dangerously optimistic picture of your CAC, making unprofitable campaigns look like absolute winners.
Your true acquisition cost is a much broader figure. It has to include every single dollar you spend to bring a new buyer through the door. To get a true financial picture of your acquisition engine, you need a holistic view.
Beyond the Ad Spend
To calculate an accurate, fully-loaded CAC, you have to account for all the moving parts. This means looking past the obvious ad platform bills and digging into the expenses that are easily overlooked. Think of it as the complete budget for your growth machine.
Here’s what you should be including in your calculation:
- Marketing Team Salaries: The compensation for your in-house marketers, from your CMO right down to your content creators.
- Agency & Freelancer Fees: Those monthly retainers for your performance marketing agency, SEO contractors, or copywriters.
- Essential Software Subscriptions: The monthly costs for your entire marketing tech stack. We're talking about tools like Klaviyo for email, Canva for creative, or even the Shopify apps that support your acquisition efforts.
- Creative & Content Production: Any money spent on ad creatives, photoshoots, or video content.
Overlooking these "soft costs" is like trying to bake a cake and only counting the flour. You're missing critical ingredients, and the final result won't be what you expect. Your team's salaries and software are direct investments in customer acquisition, period.
Why This Deeper Calculation Matters
So, why does this level of detail matter so much? Because a CAC based solely on ad spend is telling you a convenient lie. It hides major inefficiencies and gives you a false sense of security about your marketing performance.
When you calculate your fully-loaded CAC, you get true clarity. You might discover that a channel with a great platform-reported ROAS is actually hemorrhaging money once you factor in the creative production and agency fees required to keep it running.
This comprehensive approach is the first step toward making smarter, data-driven decisions. It moves you from just tracking expenses to strategically investing in the channels that genuinely drive profitable growth for your brand. Without it, you’re just flying blind.
Gathering Your Data Without Going Insane
To get your CAC right, you first have to round up all the numbers. For most Shopify founders, this is where the wheels fall off. The data lives in a dozen different places, and pulling it all together by hand is a tedious chore that’s just asking for errors.
This isn’t about needing a data science degree; it’s about knowing where to look and what to grab. The old-school way involves exporting CSVs from multiple platforms and painstakingly stitching them together in a spreadsheet—a process that’s both a massive time-suck and almost guaranteed to be wrong.
Pinpointing Your Key Data Sources
To get the full picture, you need to pull from three core areas of your tech stack. Think of these as the main ingredients for your CAC calculation.
- Ad Platforms: Log into your Meta Ads and Google Ads managers. You’ll need to export your total ad spend for whatever period you're measuring (say, the last month or quarter).
- Financial & HR Systems: This is where you'll find marketing payroll and agency invoices. You need to isolate the gross salaries for your marketing team and any fees you paid to freelancers or marketing agencies.
- Software & Subscriptions: Track down your monthly or annual invoices for marketing-related software. This includes your email platform (like Klaviyo), design tools, and any Shopify apps tied directly to customer acquisition.
The manual grind here is exactly the problem that modern analytics tools were built to solve. Instead of you doing the work, AI-powered platforms can automatically and continuously pull data from Shopify, GA4, Meta, and your other tools into a single source of truth. If you're tired of spreadsheet chaos, you should explore building an integrated eCommerce analytics dashboard that does this for you.
Choosing the Right Attribution Window
Another critical piece of the data puzzle is defining your attribution window. This is simply the timeframe after someone interacts with your ad (clicks or views it) during which a conversion can be credited back to that ad.
The two most common models you’ll see are:
- 7-Day Click: A purchase is attributed to an ad if the customer clicked it within the last 7 days.
- 28-Day Click: A purchase is attributed if the customer clicked an ad within the last 28 days.
So which one is right for you? It depends. For products with a shorter consideration period—think apparel, supplements, or consumables—a 7-day click window is often more accurate. For higher-ticket items like furniture or electronics where customers take longer to decide, a 28-day click model might make more sense.
Founder Tip: Don't just default to the longest window possible. A shorter, more conservative window like 7-day click often gives you a tougher but more realistic view of your ad performance. It keeps you from over-attributing sales to clicks that happened weeks ago.
Ultimately, getting this data together is the foundational step. While you can do it manually, it highlights a major bottleneck in your operations. The goal is to move past this data-wrangling phase so you can spend your time analyzing insights, not just compiling numbers.
Calculating Blended vs. Channel-Specific CAC
Alright, you've got your data lined up. Now it's time to put it to work. This is the moment you move from just knowing your numbers to actually using them to make faster, smarter decisions for your Shopify store. And the first, most critical distinction to make is between a blended CAC and a channel-specific CAC.
Your blended CAC is the simple, top-level view. You just take all your marketing and sales costs, throw them in a pot, and divide by the total number of new customers you brought in. It’s a decent health check for the business overall, but it has a massive blind spot—it can easily hide a channel that's secretly burning through your budget without pulling its weight.
The Danger of a Blended-Only View
Let's play this out. Imagine your Shopify store has a blended CAC of $45, and your average order value is $75. On the surface, things look pretty good, right? You're profitable on that first purchase.
But what if that $45 is just an average of two completely different stories? What if your Google Ads are actually bringing in new customers for just $25, while your Meta Ads are costing you a whopping $85 per customer?
Suddenly, the picture is a lot clearer. One channel is a well-oiled machine, and the other is a money pit. A blended CAC would never show you this, and you'd likely keep pouring cash into a campaign that's dragging you down. This is exactly why you have to calculate a channel-specific CAC. It’s not optional if you want to grow sustainably.
To get an accurate calculation, you need to pull together a few key data streams.
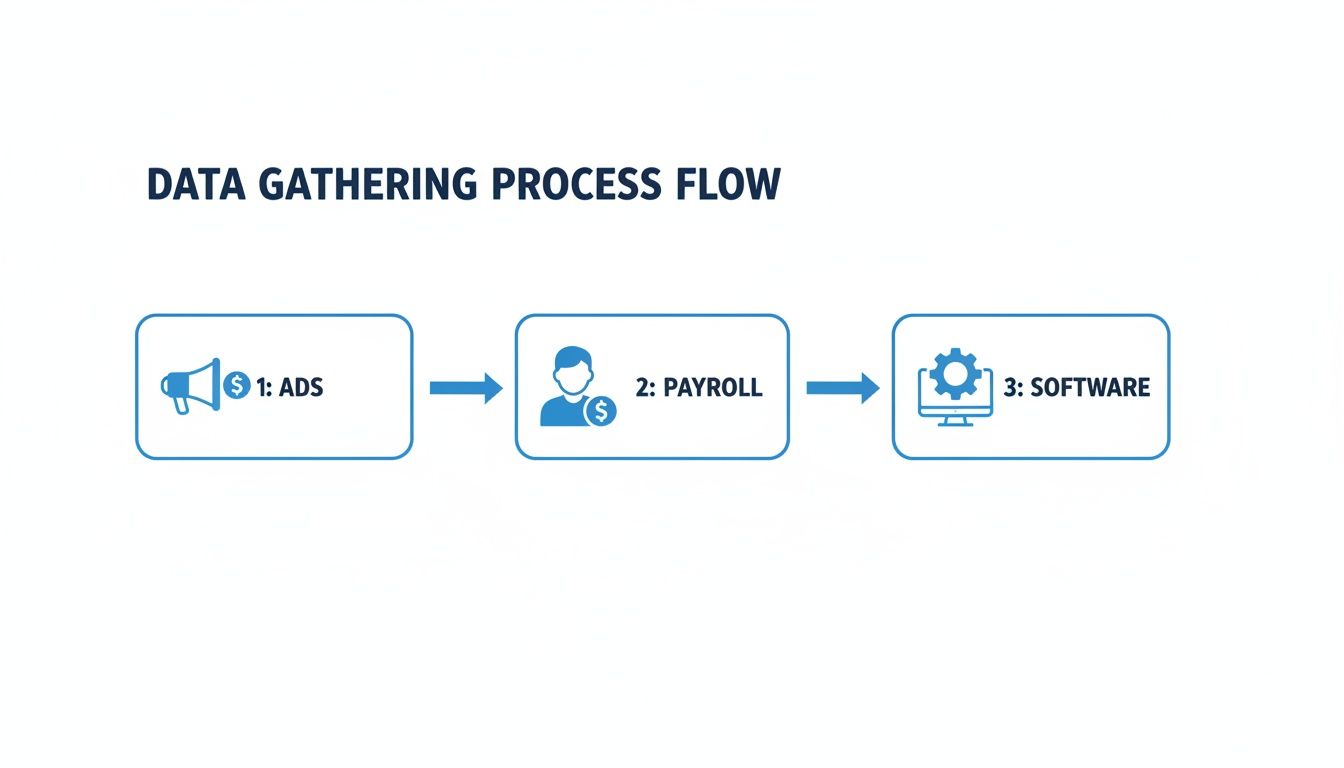
This process visualizes how everything—ad spend, team payroll, and software costs—has to be combined to get a true picture of your acquisition expenses.
Calculating Your Channel-Specific CAC
To get your CAC for a specific channel, you need to isolate the costs tied only to that channel and divide them by the new customers acquired from that same channel.
Let's use a real-world Shopify example. Say you're a clothing brand looking at last month's numbers:
- Meta Ads:
- Ad Spend: $10,000
- New Customers Attributed: 150
- Meta CAC = $10,000 / 150 = $66.67
- Google Ads:
- Ad Spend: $5,000
- New Customers Attributed: 200
- Google CAC = $5,000 / 200 = $25.00
In this scenario, Google Ads is 2.6x more efficient at acquiring customers than Meta. This is the kind of powerful, actionable insight that gets lost in manual spreadsheets.
Of course, this is also where things get tricky with attribution, especially when a customer clicks on ads from multiple channels. If you want to go deeper on that, check out our guide on multi-touch attribution modeling to better understand how to assign credit across the entire customer journey.
Let's look at how misleading a blended CAC can be side-by-side.
Blended CAC vs Channel Specific CAC Example
This table shows exactly how a single blended CAC figure can hide what's really happening under the hood with your marketing channels.
| Metric | Meta Ads | Google Ads | Blended Total |
|---|---|---|---|
| Total Spend | $10,000 | $5,000 | $15,000 |
| New Customers | 150 | 200 | 350 |
| CAC | $66.67 | $25.00 | $42.86 |
See the problem? The blended CAC of $42.86 looks healthy enough, but it completely masks the fact that your Meta Ads are nearly 3x as expensive as your Google Ads. Without this channel-specific view, you'd have no idea where to shift your budget for better returns.
Key Takeaway: Analyzing channel-specific CAC moves you from being a passive observer of your business metrics to an active strategist. It gives you the confidence to allocate your budget effectively—doubling down on what works and cutting what doesn't.
This kind of granular analysis is the foundation of profitable scaling. It's also why we built MetricMosaic. Our platform automates this entire process, connecting directly to your Shopify and ad accounts to deliver these insights without all the manual data crunching. You get a clear, real-time view of which channels are truly driving your growth.
Connecting CAC to LTV: The Metric That Actually Matters
Knowing how much it costs to acquire a customer is a massive step forward, but honestly, it’s only half the story.
A $50 CAC might be a fantastic deal for one Shopify store but a complete disaster for another. The real question isn't just "What did they cost?" but "What are they worth?"
This is where the conversation shifts from pure cost accounting to true profitability. An expensive customer who comes back to buy from you ten times is infinitely more valuable than a cheap one who never returns. To get a grip on this, you need to connect your CAC to another crucial metric: Customer Lifetime Value (LTV).
LTV is the total revenue you can reasonably expect from a single customer throughout their entire relationship with your brand. When you put it side-by-side with CAC, you finally get the context you need to judge whether your ad spend is building a sustainable business or just lighting cash on fire.
The LTV to CAC Ratio
The gold standard for this relationship is the LTV:CAC ratio. This simple formula tells you how many times over a customer pays back their acquisition cost. Think of it as the ultimate health score for your DTC growth engine.
For most DTC brands, the magic number is a 3:1 ratio or higher. For every dollar you spend to get a customer, you should be getting at least three dollars back in lifetime revenue.
Here's a quick breakdown:
- A 1:1 ratio is a red flag. You’re losing money once you factor in the cost of goods sold (COGS) and other operational expenses. You’re essentially buying revenue at a loss.
- Below 3:1 means you have very thin margins for profit and will probably struggle to scale.
- A 3:1 ratio is the benchmark for a healthy, scalable business model.
- Hitting 4:1 or higher? You've got a great thing going. It might even be a sign you’re underinvesting in marketing and have room to acquire customers more aggressively.
Calculating LTV can feel tricky, especially for newer stores without years of historical data. This is where AI-powered analytics platforms like MetricMosaic come in handy. They can use predictive models to forecast future customer value based on early purchasing behavior, taking a lot of the guesswork out of the equation.
Don't Forget Your CAC Payback Period
There’s one more piece to this puzzle: the CAC Payback Period. This metric tells you how long it takes, in months, to earn back the money you spent to acquire a customer. For a cash-strapped DTC brand, this is everything.
A shorter payback period means you can reinvest your cash into growth much faster. Ideally, you want to get your money back within 6 to 12 months. If your payback period stretches to 18 or 24 months, it puts a serious strain on your cash flow, even if your LTV:CAC ratio looks healthy on paper.
Focusing only on CAC without considering LTV and payback period is like driving a car while only looking at the speedometer. You know how fast you're going, but you have no idea if you're heading toward a cliff or an open road.
Ultimately, calculating customer acquisition cost is just the starting point. The real strategic insights come when you connect that cost to the long-term value it creates. That’s when you get a complete picture of your brand's financial health and true potential for growth.
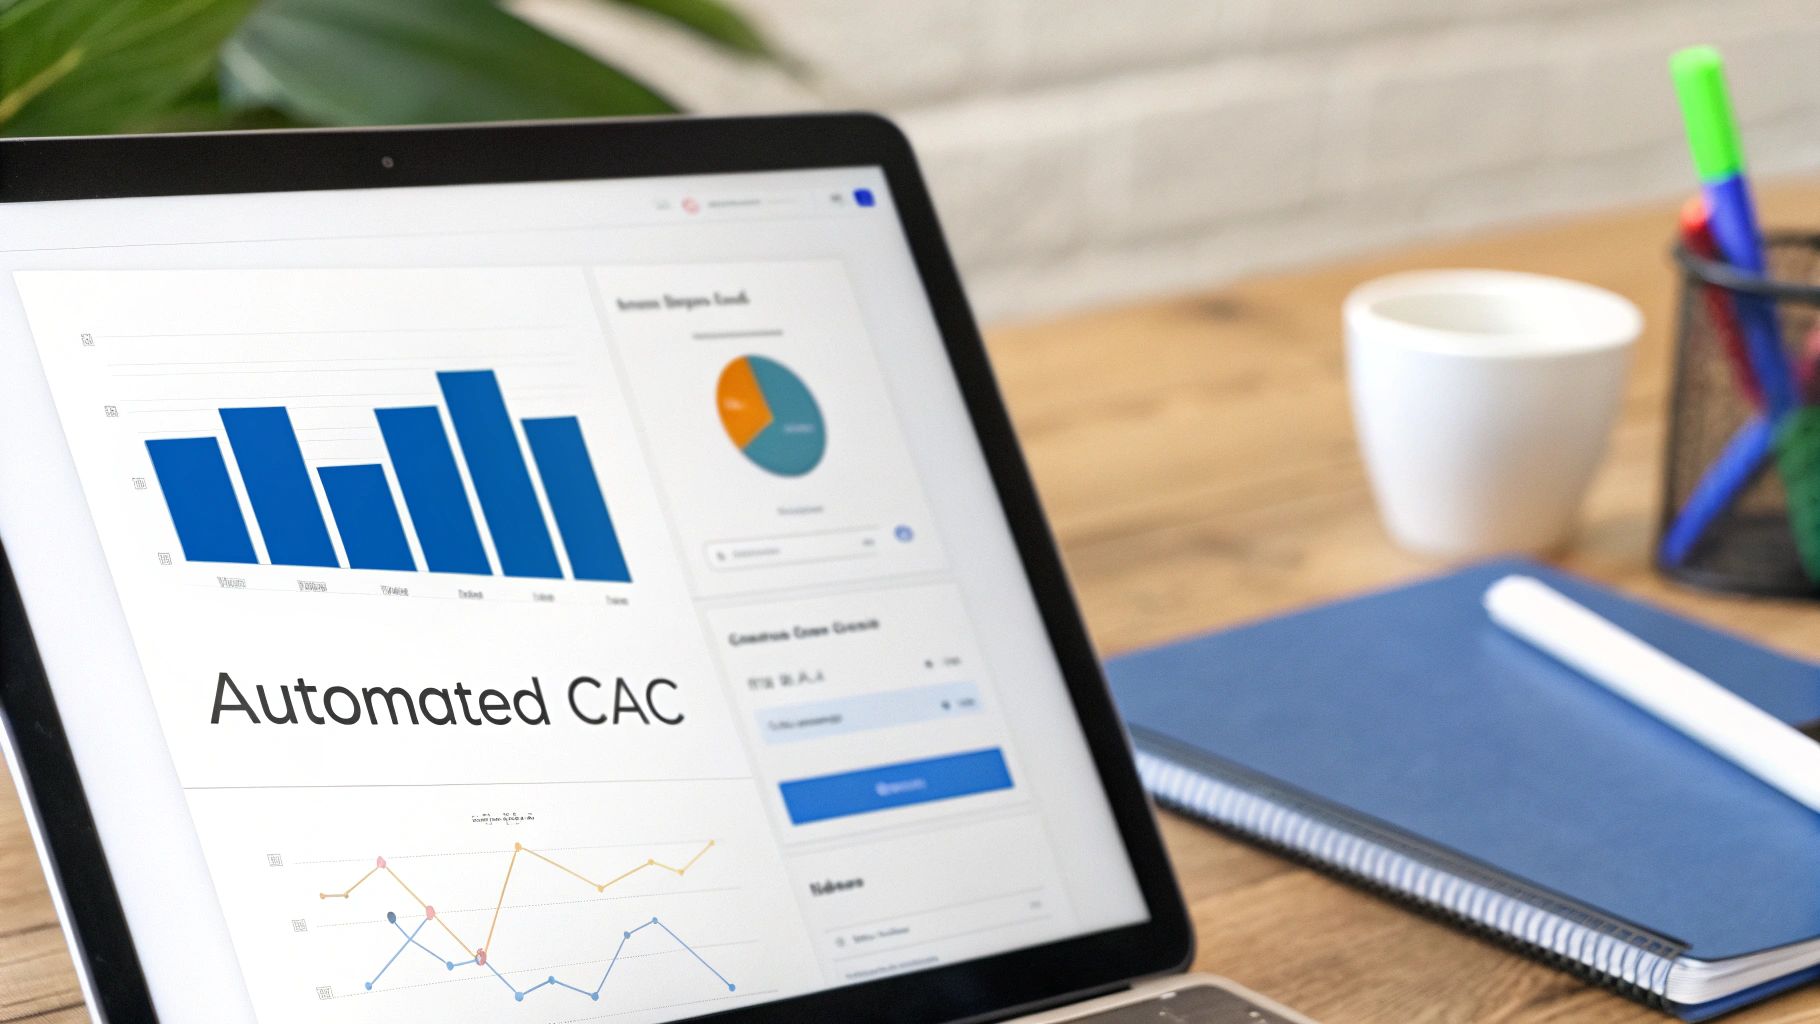
Automating Your CAC Tracking with AI
Let's be honest. As a founder, your time is your most valuable asset. Spending hours wrestling with spreadsheets to manually calculate your customer acquisition cost isn't just a drag—it's a massive misallocation of your energy.
Your focus should be on big-picture growth, not drowning in CSV exports and pivot tables. This is the point where you have to move beyond manual calculations and into intelligent, automated monitoring.
Modern AI-powered analytics platforms were built to solve this exact problem. They plug directly into your entire tech stack—Shopify, Meta, Google, Klaviyo—and create a single source of truth for your brand.
From Spreadsheets to Conversations
Imagine a world where you never have to export another CSV. Instead of spending half a day crunching numbers, you have a real-time CAC dashboard that’s always on and always accurate. That’s the power of consolidating your data automatically.
But it gets better. The next generation of tools is all about conversational analytics. This means you can literally just ask your data questions in plain English, like:
- "What was our CAC from the Black Friday campaign?"
- "Show me the LTV:CAC ratio for our top three ad campaigns last quarter."
- "Which channels have the shortest CAC payback period?"
This approach turns complex analysis into a simple conversation. It makes deep insights accessible to everyone on your team, not just the data analysts. For DTC brands, especially in competitive niches, finding the right tech stack is a game-changer. This guide on the best AI tools for fashion brands explores some powerful options.
Proactive Insights That Drive Action
The real magic of AI isn't just the automation; it's the proactive intelligence. Instead of you having to hunt for problems, the platform brings them directly to you.
AI-generated "Stories" can flag when your CAC is creeping up on a specific channel or for a particular audience, giving you a heads-up before it eats into your margins. You can dive deeper into how predictive analytics for eCommerce helps you get ahead of these trends.
This shift from being reactive to proactive is what gives you a real competitive advantage. You can take immediate, decisive action—like pulling budget from an underperforming ad set—before a small issue becomes a major drain on your profitability. It transforms your data from a historical record into a forward-looking guide for growth.
Ready to stop guessing and start growing? MetricMosaic is the AI-powered growth co-pilot for Shopify brands that turns your store's data into clear, actionable insights. Unify your data, get answers in plain English, and let AI-driven Stories guide you to higher profits. Start your free trial today.