Ecommerce Analytics Dashboard: Turn Your Shopify Data into Profit with AI
Turn Shopify data into profit with an ecommerce analytics dashboard that delivers AI-powered insights and smarter DTC growth.
Let's be honest—running a Shopify brand often feels like you're drowning in fragmented data. You’ve got one tab open for Shopify sales, another for GA4 traffic, a messy spreadsheet for your Meta Ads, and yet another for Klaviyo. You have the numbers, but what are they really telling you?
This scattered view makes it nearly impossible to see your true return on ad spend (ROAS) or spot growth opportunities before they disappear. You're stuck in a reactive cycle, trying to piece together a story from clues spread across a dozen platforms. It's a constant guessing game:
- Which marketing channel is actually bringing in your most profitable customers?
- Is that new ad campaign cannibalizing sales from another?
- Why did your repeat purchase rate dip last month?
Answering these questions requires stitching together data manually—a process that’s both time-consuming and prone to errors. This is where a modern, AI-powered ecommerce analytics dashboard changes everything for DTC brands.
The Shift from Reports to a Central Nervous System
Think of a traditional report as a snapshot—a static picture of what happened yesterday. An AI-powered analytics dashboard, however, is a live video feed of your entire business. It's not just another tool; it's the central nervous system for your Shopify brand, providing a single source of truth that transforms data chaos into actionable clarity.
This shift moves you from being a data-gatherer to a decision-maker. Instead of crunching numbers in a spreadsheet, you're empowered to spot trends, ask better questions, and act with confidence. It’s about turning your everyday store data into a genuine competitive advantage. For ambitious DTC brands, exploring the power of real-time e-commerce analytics can reveal immediate insights that prevent costly mistakes and highlight hidden opportunities. Instead of just reacting to past performance, you can proactively make decisions guided by a cohesive story your data is trying to tell you.
A powerful dashboard doesn't just show you metrics; it reveals the relationship between them. It connects your ad spend to your LTV, your AOV to your marketing campaigns, and your customer behavior to your bottom line.
This is how you get out of the weeds and focus on strategy—the kind that boosts ROAS, lowers your CAC, and ultimately drives real profit.
Building Your Dashboard With Must-Have Metrics and Data Sources
A truly useful ecommerce dashboard isn’t built on vanity metrics like website sessions or a flurry of social media likes. It’s built on the KPIs that tell the real story of your business's health, profitability, and where it’s headed. Without them, you’re flying blind, just guessing at how your marketing spend actually connects to your bottom line.
To build a dashboard that actually drives decisions, you have to bring together data from a few key places. For most Shopify brands, this means unifying Shopify for sales and product data, Google Analytics 4 for on-site behavior, Meta Ads for top-of-funnel performance, and Klaviyo for customer retention. The real magic happens when you get these streams talking to each other, replacing manual data crunching with an automated, unified view.
This infographic shows what it looks like when you stop jumping between tabs and unify everything in one place.
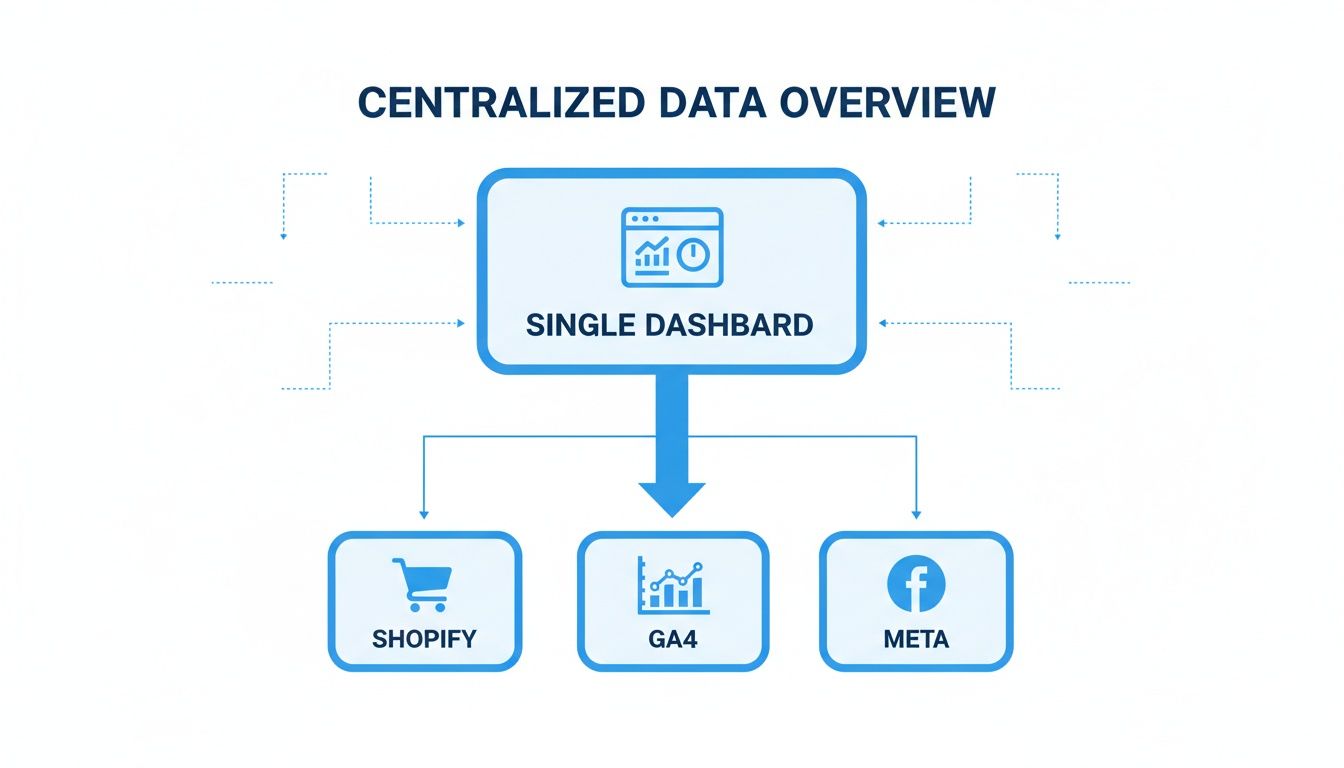
By pulling these sources together, you create a single source of truth. No more fragmented reports, no more guesswork.
So, what metrics should you actually be tracking? Here’s a breakdown of the essentials every DTC brand needs on their dashboard, organized by the part of the business they illuminate.
Essential Metrics for Your Ecommerce Analytics Dashboard
| Category | Key Metric | Why It Matters for a DTC Brand | Primary Data Source(s) |
|---|---|---|---|
| Marketing Engine | Return On Ad Spend (ROAS) | The most direct measure of ad efficiency. Are your campaigns actually making money? | Meta Ads, Google Ads |
| Marketing Engine | Customer Acquisition Cost (CAC) | Exactly what you pay, on average, to get a new customer. Essential for managing your budget. | Meta Ads, Google Ads |
| Marketing Engine | Blended CAC (BCAC) | A holistic view that averages acquisition costs across all channels, paid and organic. | Shopify, GA4, Ad Platforms |
| Sales Performance | Conversion Rate | The percentage of visitors who buy something. A critical sign of your store's UX and product appeal. | Shopify, GA4 |
| Sales Performance | Average Order Value (AOV) | How much customers spend in a single transaction. Increasing this is a fast track to more revenue. | Shopify |
| Customer Value | Customer Lifetime Value (LTV) | A forecast of the total revenue a customer will bring in over time. This is your long game. | Shopify, Klaviyo |
| Customer Value | LTV:CAC Ratio | Compares customer value to acquisition cost. A healthy 3:1 ratio means your business model is working. | Shopify, Ad Platforms |
| Customer Value | Repurchase Rate | The percentage of customers who come back for more. A direct measure of satisfaction and loyalty. | Shopify, Klaviyo |
| Profitability | Gross Margin | The profit you make on products after subtracting the cost of goods sold (COGS). A fundamental health check. | Shopify |
| Profitability | Product-Level Profit | The true profit on individual SKUs after all costs (marketing, shipping) are factored in. | Shopify, Ad Platforms, Shipping |
This table isn't just a list; it's a blueprint. Tracking these metrics together gives you a complete narrative of how a customer finds you, what they buy, whether they come back, and—most importantly—how much profit you actually make from it all.
Uncovering Your True Profitability
Ultimately, your dashboard has to connect every click and every order back to your bottom line. Revenue is great, but profit is what keeps the lights on and fuels growth. Digging into SKU-level performance is where you often find the biggest opportunities.
An AI-driven dashboard can reveal that customers acquired through a specific Meta campaign have a 30% higher LTV than those from Google Ads, even if their initial CAC is similar. This insight allows you to reallocate spend for long-term profit, not just short-term sales.
As you start to pull all of this together, choosing an Ecommerce Dashboard Solution becomes a critical step. You need a platform that can not only display these numbers but also help you find the stories hidden within them. That’s how you move from just tracking data to making confident, profit-driven decisions.
Learning to Read the Story Your Dashboard Is Telling You
Having a dashboard packed with metrics is one thing. Knowing what those numbers actually mean for your Shopify brand? That's everything.
Your ecommerce analytics dashboard isn’t just a scoreboard—it's a storyteller. Learning to read its narrative is how you stop reacting to the past and start proactively shaping your brand’s future.
This is where so many DTC founders get stuck. You see the charts, but you're left wondering, "Okay, so what?" The secret is to stop looking at metrics in isolation and start connecting the dots. Each data point is a character in your business's story, and how they interact reveals the plot.
Connecting Data Points to Uncover Insights
Think of yourself as a detective. A single clue rarely cracks the case, but when you link multiple clues together, a clear picture starts to form. Your dashboard works the exact same way.
Let’s walk through a common scenario for a Shopify store: your Return on Ad Spend (ROAS) is dropping, but your Customer Acquisition Cost (CAC) is holding steady. What’s the story here?
- The First Clue: A lower ROAS suggests your ads are becoming less efficient.
- The Contradiction: A stable CAC means it still costs the same to bring in a new customer.
- The Plot Twist: A stable CAC alongside a falling ROAS often points a finger directly at a declining Average Order Value (AOV) or a lower Repurchase Rate. You’re paying the same for customers, but they're now spending less.
That single insight gives you an immediate action plan. Instead of just tinkering with ad creative, you know you need to investigate why AOV is slipping. Are customers no longer bundling products? Did you remove a popular upsell? An AI-powered tool like MetricMosaic can surface these connections for you, turning a confusing trend into a clear, actionable task.
From Diagnosis to Actionable Strategy
Your dashboard is your diagnostic tool. Once you identify the "what," you can dig into the "why" and decide on the "how."
A great ecommerce analytics dashboard doesn't just present data; it provokes questions. Why did that cohort’s LTV spike? What caused last week’s cart abandonment surge? These questions are the starting point for meaningful growth.
Let's take another example. You notice a slight dip in the repurchase rate for customers you acquired during the last holiday season. On its own, that might not seem too alarming.
But if you cross-reference that with your product-level profitability, you might discover that the top-selling product from that campaign also has a crazy-high return rate. Suddenly, it all makes sense. The bad experience discouraged a second purchase. The action is clear: launch a targeted retention campaign for that specific cohort, maybe offering a discount on a different, more reliable product to win back their trust.
Building Your Interpretive Muscle
The ability to interpret your dashboard is a skill, and like any muscle, it gets stronger with practice. The e-commerce platform market is projected to surge from USD 10.46 billion in 2025 to USD 45.60 billion by 2033, and brands that can quickly interpret their data will have a massive advantage. You can learn more about the future of e-commerce platforms and their analytics.
Start by focusing on the relationships between key metrics. Don't just track AOV; track how it changes in response to your marketing campaigns. Don't just look at LTV; segment it by acquisition channel to find out where your most valuable customers are really coming from.
This story-driven approach, powered by an intelligent ecommerce analytics dashboard, is how you translate numbers into strategy. No data science degree required.
Supercharging Your Analytics With an AI Co-Pilot
Let's be honest, traditional dashboards are useful, but they're stuck in the past. They show you what happened yesterday or last week, leaving you to connect the dots and figure out what to do next. An AI-powered ecommerce analytics dashboard completely changes the game.
Think of it like the difference between a static paper map and a live GPS. The map shows you the terrain, but the GPS actively guides you, reroutes you around traffic, and tells you exactly when you'll arrive. That’s the leap you make when you bring an AI co-pilot into your workflow.

AI takes on the most tedious parts of analytics for your Shopify store. It automates the complex data unification and instantly calculates tricky metrics like true LTV and CAC payback periods. It's the end of spreadsheet headaches and manual data crunching.
From Manual Data Crunching to Instant Answers
As a busy DTC founder, your time is everything. You don't have hours to dig through reports just to answer a simple question. This is where next-gen trends like conversational analytics transform how you interact with your data.
Platforms like MetricMosaic are built around making insights as easy to get as having a conversation.
- Conversational Analytics: Imagine just asking your dashboard, "What was our blended ROAS for the new spring collection campaign on Meta last week?" and getting an instant, accurate answer. This is the power of conversational analytics—you can "chat" with your data in plain English. No code or complex filters needed.
- Story-Driven Data: Instead of just showing you a chart and leaving you to interpret it, an AI co-pilot proactively surfaces insights. It might generate a "Story" that says, "Your repeat purchase rate for customers acquired via TikTok has dropped 15% in the last 30 days. This cohort is at high risk of churning." You go from hunting for problems to having them delivered right to you.
An AI co-pilot doesn't just present numbers; it builds a narrative. It proactively tells you what's working, what's broken, and where your next big opportunity lies, empowering your entire team to make smarter decisions in seconds, not days.
This democratizes data, allowing your marketing manager, your operations lead, and you to all get the answers you need without waiting on a dedicated analyst.
Unlocking Predictive and Proactive Insights
The real magic of AI in an ecommerce analytics dashboard is its ability to look forward, not just backward. It moves beyond reporting on the past to predicting the future and prescribing what to do about it.
This forward-looking capability is what drives sustainable growth. The market for customer analytics in e-commerce—the backbone of these modern dashboards—is set to explode from USD 14,921.2 million in 2025 to a massive USD 49,221.3 million by 2035. This boom is fueled by predictive insights that help brands focus on their most valuable segments for much higher returns. You can discover more about the future of customer analytics and its market trajectory.
AI-powered analytics brings these advanced capabilities to your Shopify brand without needing a data science team.
Here’s what that actually looks like:
- Predictive Churn Alerts: The system can analyze buying patterns to spot customers who are likely to churn before they actually leave. This opens up a critical window for you to launch a targeted win-back campaign to improve retention.
- Forecasting Future LTV: AI models can predict the lifetime value of new customer cohorts based on their initial behavior and acquisition channel. This helps you figure out which channels are bringing in the most profitable customers long-term, not just the cheapest ones today.
- Proactive Opportunity Spotting: The AI might notice that customers who buy Product A are 70% more likely to return within 60 days to buy Product B. It can surface this as a clear opportunity, suggesting you create a product bundle or a post-purchase email flow to accelerate that exact behavior and boost AOV.
By embedding an AI co-pilot into your workflow, your dashboard stops being a passive reporting tool and becomes an active growth partner. It's constantly scanning your data for threats and opportunities, making sure you never miss a chance to improve profitability.
Creating Your Dashboard Review Rhythm
An analytics dashboard is a bit like a high-performance engine. It's powerful, but it won't get you anywhere unless you know how to use it—and check on it regularly. A consistent review rhythm is what turns your dashboard from a reactive, "oh no, something's broken" tool into a proactive driver for real growth.
The trick is to build a habit that actually fits into your already-insane schedule as a founder or marketer. You don't need to spend hours a day glued to your charts. It's about creating a simple, repeatable workflow broken down into daily, weekly, and monthly check-ins.
This approach keeps you on top of what matters without getting lost in the weeds. It makes dashboard reviews a quick, effective part of your operation, not a chore.
The 5-Minute Daily Health Check
Think of this as your morning coffee check-in. The goal isn't deep analysis. It's about spotting any immediate red flags or opportunities that need your attention today. This quick pulse check is what stops small issues from spiraling into weekend-ruining problems.
Your daily once-over should hit the most volatile, time-sensitive numbers:
- Real-Time Sales Velocity: Are sales pacing where they should be for a Tuesday morning? A sudden dip might mean your checkout just broke.
- Ad Spend and Campaign ROAS: Is your ad spend on track? More importantly, are your key campaigns performing? Catching a nosedive in ROAS early can save you thousands in wasted ad budget.
- Site Performance: Is there a weird drop in conversion rate or a sudden spike in abandoned carts? That could be a sign of a technical glitch on your Shopify store that needs fixing, fast.
This isn't the time to make big strategic moves. It’s all about operational awareness. An AI-powered dashboard like MetricMosaic makes this even faster by sending you an alert if a key metric suddenly goes off the rails.
The 30-Minute Weekly Performance Review
Okay, this is where you get to zoom out a bit. Your weekly review is for assessing trends and making tactical adjustments for the week ahead. It's your chance to look at the "why" behind the daily numbers.
Your weekly review is about connecting the dots. It’s where you move from monitoring to managing, asking not just "what happened?" but "what should we do next?"
Here’s what to dig into during your weekly session:
- Channel Performance: Which channels—Meta, Google, Klaviyo—drove the most profitable growth?
- New vs. Returning Customer Trends: How did your customer mix look last week? A healthy brand needs a solid flow of both. If new customer acquisition is slowing down, maybe it’s time to switch up your ad creative.
- Average Order Value (AOV): Is AOV trending up or down? If it's down, were people buying fewer upsells, or did that popular bundle you were pushing go out of stock?
- Top and Bottom Performing Products: What's flying off the virtual shelves, and what's collecting dust? This is pure gold for informing your ad focus and inventory planning.
The Monthly Deep-Dive Strategy Session
Once a month, block out an hour or two. This is your strategy session. Here, you’re looking at the big-picture metrics that define the long-term health and profitability of your brand. These are the numbers that should inform your major budget decisions and growth plans for the next quarter.
Your monthly deep-dive should cover:
- Customer Lifetime Value (LTV) by Cohort: Are the customers you acquired three months ago coming back? How does their LTV stack up against the cohort from six months ago? This is key for retention.
- CAC Payback Period: How long does it take to actually make back the money you spent to get a new customer? The shorter this period, the faster you can pour that cash back into growth.
- Overall Blended Profitability: After you account for everything—COGS, ad spend, shipping, transaction fees—was the business actually profitable last month? Which channels and products contributed the most to your real bottom line?
Integrating this rhythm of daily, weekly, and monthly reviews is what separates the brands that just have data from the ones that use it to win.
Your Ecommerce Dashboard Review Cadence
To make this simple, here’s a quick schedule you can adopt to integrate dashboard analysis into your operations without it feeling like a burden.
| Cadence | Key Focus Areas | Goal of the Review |
|---|---|---|
| Daily (5 Mins) | Sales Velocity, Ad Spend/ROAS, Conversion Rate, Cart Abandonment | Spot and fix immediate operational issues. Think of it as firefighting. |
| Weekly (30 Mins) | Channel Performance, New vs. Returning Customers, AOV, Product Performance | Identify trends and make tactical adjustments for the week ahead. |
| Monthly (1-2 Hrs) | LTV by Cohort, CAC Payback Period, Blended Profitability | Assess long-term health and make strategic decisions on budget and growth. |
Sticking to a schedule like this ensures you're consistently turning your data into deliberate, informed actions that move your business forward.
Alright, you've seen the pitfalls of scattered data and the promise of a clear, story-driven approach. Now it's time to stop learning and start doing. Let's get your own AI-powered ecommerce analytics dashboard running and turn your store's data into your biggest advantage.
Getting from data chaos to real clarity is way faster than you might think. Modern platforms like MetricMosaic were built for busy Shopify founders, not data scientists. The whole point is to get you from connecting your accounts to finding real insights in minutes, not months. This last step isn’t about a long, painful setup—it's about making your next move feel both exciting and totally achievable.
Your Simple Implementation Checklist
Getting started with an AI co-pilot is surprisingly straightforward. There's no code, no complicated setup, no technical headaches. The entire experience is designed to automate the heavy lifting so you get value right away.
Here’s the simple path from where you are now to making smarter, profit-driven decisions:
Connect Your Shopify Store: With a one-click integration, you can securely link your Shopify account. The platform immediately starts pulling in all your historical sales, product, and customer data.
Link Your Ad Accounts: Next, connect your key marketing channels like Meta Ads and Google Ads. This is the magic step. It’s what lets the AI calculate your true blended CAC, ROAS, and correctly attribute sales back to the right campaigns.
Add Other Key Sources: To get the full picture, connect tools like Klaviyo for retention data or Google Analytics 4 for a deeper look at on-site behavior.
Once your sources are connected, the AI takes over. It automatically cleans, unifies, and models your data, building out your dashboard with all the essential metrics. You don’t have to create formulas for LTV or CAC payback—it’s all done for you. Within just a few hours, you can start asking questions and exploring insights that used to be buried in spreadsheets.
Your first dashboard isn't just the end of a setup process; it's the beginning of a whole new way of running your business. It's your launchpad for proactive, data-informed growth, where every single decision is backed by a clear story.
This is how you build a real competitive advantage. You stop guessing and start knowing. By activating an AI-powered ecommerce analytics dashboard, you're not just adding another tool—you're installing a system for sustainable, profitable growth.
A Few Common Questions
If you're digging into the world of ecommerce analytics, you probably have a few questions. That's a good thing. It means you're taking this seriously. Here are the honest, no-fluff answers to the ones we hear most often from founders.
What's The Real Difference Between Free and Paid Dashboards?
This is a great question. Free tools like Google Analytics are fantastic for what they do—they give you a solid read on website traffic and how people are behaving on your site. You can see where they click, what pages they visit, and how long they stick around.
But they can't see the whole picture.
A paid, AI-powered ecommerce analytics dashboard connects the dots. It pulls in your Shopify sales data and marries it with your ad spend from Meta, Google, and wherever else you're running ads. That's how you get the metrics that actually matter for profitability—things like Customer Acquisition Cost (CAC), your true blended ROAS, and Customer Lifetime Value (LTV). Free tools show you activity; a purpose-built dashboard shows you profit.
How Long Does It Take to Set Up a New Dashboard?
I get it. The last thing you have time for is a six-month implementation project. Modern AI-powered platforms have completely changed the game. For a tool like MetricMosaic, the entire process is designed to be painless and fast. No coding, no developers needed.
Here’s what it actually looks like:
- You connect your Shopify store with a single click.
- You link your ad accounts (Meta, Google, etc.) in just a few minutes through a secure process.
- Then you can literally watch as the AI gets to work, pulling in, cleaning up, and organizing all your historical data.
Most brands go from signing up to exploring a fully loaded, insight-rich dashboard in a couple of hours. Not weeks. The whole point is to give you answers, not another project.
Can AI Really Make Analytics Easier for a Small Team?
Absolutely. In fact, that's its biggest strength. AI isn't about replacing people; it's about giving a small, scrappy team the power of a dedicated data analyst without the six-figure salary.
Instead of spending hours exporting CSVs and wrestling with pivot tables just to figure out your LTV, the AI handles all of that automatically. But it goes a step further. With next-gen features like conversational analytics and story-driven data, you can just ask plain-English questions like, "Which campaign had the best LTV last quarter?" and get an immediate, clear answer. It makes everyone, from the founder to the marketing manager, smarter and faster.
Ready to stop guessing and start growing with a clear, unified view of your business? MetricMosaic is the AI-powered analytics co-pilot designed for Shopify brands that need to turn complex data into profitable action. Start your free trial today and see the story your data is telling you.