What Is the Contribution Margin for DTC Brands
Discover what is the contribution margin and how to use it. Our guide explains the formula with clear examples to help Shopify stores drive real profitability.
So, what exactly is contribution margin? Put simply, it’s the revenue you have left from a sale after subtracting all the variable costs tied directly to that sale. This is the cash that contributes to covering your fixed costs. Once those are paid, it's pure profit.
For brands on Shopify, this isn't just an accounting term—it's arguably the truest measure of a product's real-world profitability.
The Missing Piece in Your DTC Profitability Puzzle

Does this sound familiar? Your Shopify dashboard is glowing with sales. Your latest Meta ad campaign shows a promising ROAS. On paper, everything looks great. But when you check your bank account at the end of the month, the numbers just don't add up.
This is a classic headache for DTC founders. You're swimming in data from Shopify, Google Analytics, and your ad platforms, yet true, sustainable profit feels like a black box. The problem is that vanity metrics like total revenue or even gross profit don’t tell the whole story. They often hide the real cost of making each sale happen.
This is exactly why understanding your contribution margin is non-negotiable for growth.
Beyond Surface-Level Metrics
Think of contribution margin as the cash each individual sale generates to help pay your fixed business expenses—things like your Shopify subscription, software costs, and employee salaries. It’s the single most important metric for unlocking genuine, product-level profitability.
Without it, you could be scaling an ad campaign for a product that's actually losing you money on every single order once you factor in shipping, payment fees, and the ad spend itself. It reveals the true financial engine of your business, one sale at a time.
Contribution margin isn't just an accounting term; it's a strategic tool. It's the number that tells you whether a product is worth selling, if a marketing channel is truly profitable, and how many units you need to sell just to break even.
For too long, calculating this meant wrestling with fragmented data in complex spreadsheets. It's a manual, error-prone process that most founders simply don’t have the time for.
This is where AI-powered analytics platforms like MetricMosaic completely change the game. By automatically pulling together data from all your sources, these tools eliminate the tedious data crunching. They instantly calculate your contribution margin for every product, campaign, and channel, turning overwhelming data into a clear, actionable profitability roadmap.
This simple shift moves you from feeling lost in numbers to confidently making decisions that directly boost your bottom line.
Contribution Margin vs Other Profit Metrics
It's easy to get contribution margin confused with other metrics like gross profit or net profit. They all measure profitability, but they answer very different questions. This table breaks down the key differences.
| Metric | What It Measures | Why It Matters for DTC Brands |
|---|---|---|
| Contribution Margin | Revenue left after variable costs (COGS, shipping, transaction fees, ad spend) are subtracted. | Shows the profitability of individual products or sales. It's essential for pricing, ad spend decisions, and break-even analysis. |
| Gross Profit | Revenue left after subtracting only the Cost of Goods Sold (COGS). | A higher-level view of production efficiency. It ignores other variable costs like shipping and marketing that are critical for DTC. |
| Net Profit | The final profit after all expenses (variable and fixed) are subtracted from revenue. | The ultimate "bottom line," showing the overall financial health of the entire business. It doesn't isolate product-level profitability. |
In short, contribution margin gives you the granular, per-sale insight you need to make smart, tactical decisions every day. Gross and net profit are important, but they paint with a much broader brush.
Understanding Contribution Margin in Plain English
Let's ditch the dense accounting jargon for a second. The easiest way to think about your DTC brand’s finances is to split your costs into two buckets.
First, you have variable costs. These are the costs that move up and down in lockstep with your sales. For every single t-shirt you sell, you're paying for the blank shirt, the printing, the mailer box, and the Shopify Payments fee. Sell more shirts, and these costs go up. Sell fewer, they go down. Simple enough.
Then you have your fixed costs. These are the bills you have to pay every month, no matter what. Think of your Shopify Plus subscription, the rent on your warehouse space, or your Klaviyo plan. These expenses stay the same whether you sell one shirt or a thousand of them.
Contribution margin is the cash each sale generates to help you chip away at those fixed costs. Once your fixed costs are totally covered for the month, every dollar of contribution margin flips straight into pure profit.
It's the truest measure of a single product's financial horsepower.
The Core Formulas Every Founder Should Know
Getting a handle on contribution margin comes down to two simple formulas. One gives you a per-unit view, and the other shows you the overall efficiency of your sales.
It sounds like a lot of spreadsheet work, but a platform like MetricMosaic automates this entirely. It pulls your revenue from Shopify and your variable costs—like ad spend and COGS—and does all the math for you.
Here are the two key calculations:
Contribution Margin Per Unit: This tells you the exact dollar amount each sale kicks back to your business. It’s perfect for understanding the raw profitability of an individual product.
- Formula:
Selling Price Per Unit - Variable Costs Per Unit = Contribution Margin Per Unit
- Formula:
Contribution Margin Ratio: This shows you what percentage of each sale’s revenue is left over to cover your fixed costs. It's a fantastic way to compare the relative profitability of different products.
- Formula:
(Contribution Margin Per Unit / Selling Price Per Unit) x 100 = Contribution Margin Ratio %
- Formula:
Let’s run a quick example. Say you sell a candle for $40. All your variable costs—the wax, wick, packaging, and transaction fees—add up to $15. Your contribution margin per unit is $25.
Your contribution margin ratio is 62.5% ($25 / $40). That means 62.5 cents of every dollar earned from that candle is working to pay down your fixed costs and build profit. For a deeper dive, check out our guide to calculating contribution margin in units.
Why This Metric Is a Game Changer for DTC
The real magic of contribution margin is how directly it helps you make smarter growth decisions. For any DTC brand, this metric is the engine that covers your overhead before you can even begin talking about net income.
You might have a product with a high price tag, but if its variable costs are also sky-high, its contribution margin could be dangerously low. It’s a classic trap.
This isn’t just some obscure DTC metric, either. One famous business school case study points to a company with a 34% contribution margin ratio. That means only 34 cents of every sales dollar was left to contribute to fixed costs and, eventually, profit. This is exactly the kind of insight that helps founders and operators decide which product lines to double down on and which to kill, especially when you're trying to balance LTV with your customer acquisition costs (CAC).
How to Calculate Contribution Margin for Your Shopify Store
Alright, you get the "what" and "why" behind contribution margin. Now, let's get our hands dirty and move from theory to practice. Calculating this for your Shopify store isn't just some boring accounting exercise—it's how you uncover your true profitability, one product at a time.
If you're a DTC founder, you know the drill. You export data from Shopify, pull reports from your Meta ad account, grab numbers from your shipping software, and dump it all into a massive, sprawling spreadsheet. You spend hours just trying to match costs to individual sales. It’s a time-sucking, error-prone nightmare. This is exactly where the old way of doing analytics falls apart.
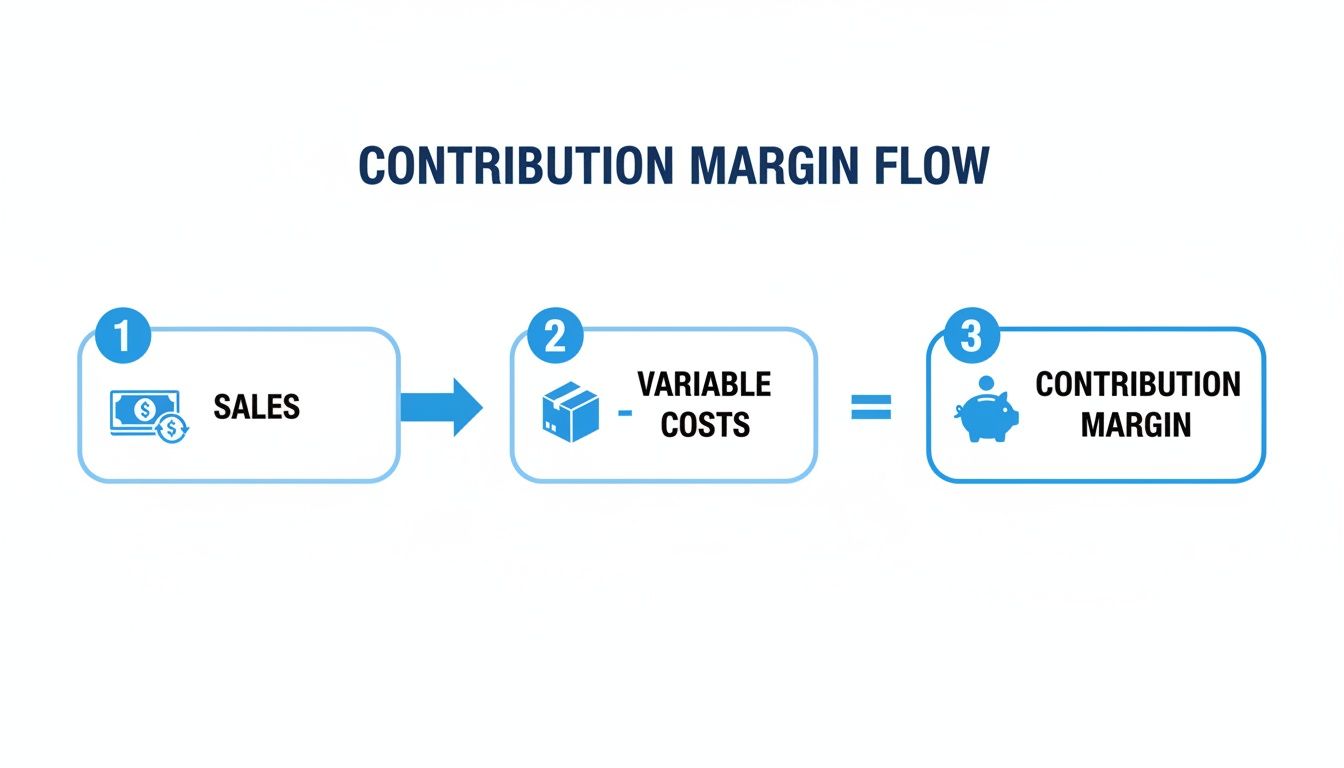
Think of it like this: every dollar from a sale has to first pass through the filter of its direct variable costs. Only what's left over can actually help pay your business's broader expenses.
This simple visual breaks down that flow:
Calculating Your Per-Unit Contribution Margin
Let's walk through a real-world example for a product you might find on any successful Shopify store—let’s say, a popular Vitamin C serum from a skincare brand.
To find its per-unit contribution margin, we need to hunt down all the variable costs that go into selling one single bottle.
Key Insight: Don't just stop at Cost of Goods Sold (COGS). For DTC brands, the most commonly forgotten variable costs are payment processing fees, shipping supplies, fulfillment labor, and—the big one—the variable advertising cost to get that single conversion.
This is a massive blind spot. Shopify’s default reports are great for tracking revenue, but they have no idea how much you spent on Meta or Google Ads to acquire that customer. This is exactly what leads founders to scale ad campaigns that are actually losing them money on every sale.
Let's break down the math for our serum.
Worked Example Calculating Per-Unit Contribution Margin
Here's a detailed look at every single variable cost associated with selling one unit.
| Item | Value | Description |
|---|---|---|
| Selling Price | $50.00 | The retail price of the serum on your Shopify store. |
| Cost of Goods Sold (COGS) | ($10.00) | The cost of the serum ingredients and the bottle itself. |
| Packaging & Inserts | ($2.50) | The box, filler paper, and any marketing inserts for one order. |
| Payment Processing Fee (3%) | ($1.50) | The fee from Shopify Payments or another processor. |
| Fulfillment Fee | ($3.00) | The cost to pick, pack, and label the order (in-house or 3PL). |
| Variable Ad Spend | ($12.00) | The average cost per conversion from your Meta Ads campaign. |
| Total Variable Costs | ($29.00) | The sum of all direct costs to sell one unit. |
| Contribution Margin Per Unit | $21.00 | The cash left over to cover fixed costs and generate profit. |
In this scenario, each serum you sell contributes $21.00 back to the business. Its contribution margin ratio is 42% ($21 / $50). Put simply, 42 cents of every dollar from this product's sales is available to pay for your Shopify plan, employee salaries, and other fixed expenses.
The AI-Powered Advantage in Calculation
Manually gathering all those data points for every single product just isn't sustainable. This is where an AI-powered analytics platform like MetricMosaic becomes your growth co-pilot.
Instead of wrestling with spreadsheets, MetricMosaic plugs directly into your whole tech stack:
- Shopify for sales and revenue data.
- Meta, Google, and TikTok Ads for real-time, variable ad spend.
- Shipping and fulfillment apps to pull in all your logistics costs.
The platform automatically pulls everything together and attributes every single variable cost to the correct sale. You get a real-time, error-free contribution margin calculation for every SKU in your store. Instantly, you can see your most (and least) profitable products without any of the manual data-crunching.
This automated clarity is what lets you make smart decisions, fast. With an accurate, up-to-the-minute handle on your numbers, you can confidently adjust pricing, optimize ad spend, and focus your marketing on the products that truly drive your bottom line. To see this in action, you can learn more about a detailed contribution margin calculation here.
Using Contribution Margin to Make Smarter Decisions
Alright, now that you've got a solid handle on how to calculate contribution margin, it's time for the fun part: putting it to work. This isn't just another number to track on a spreadsheet; it’s a strategic lever you can pull to drive real, tangible growth for your Shopify store.
When you move beyond vanity metrics like top-line revenue or even ROAS, you start making decisions like a seasoned growth strategist. This is how the pros do it.

Contribution margin directly informs the four pillars of DTC growth: pricing, product strategy, financial planning, and marketing allocation. Nail these, and you’re building a brand that thrives, not just survives.
Refine Your Pricing Strategy
Pricing is one of the toughest nuts for any founder to crack. Price too high, you kill your conversion rate. Price too low, you leave cash on the table—or worse, you actually lose money on every single sale.
Contribution margin cuts right through the guesswork.
By knowing the exact contribution margin for each product, you can see precisely how a price change will flow straight to your bottom line. A $5 price increase on a product with a $20 contribution margin doesn't just add $5 to revenue; it adds $5 directly to your profit pool. That's a 25% jump in that product's contribution from a simple tweak.
An AI-powered platform like MetricMosaic can run "what-if" scenarios, forecasting how different price points might affect overall profitability based on your real sales history. This helps you find that sweet spot that maximizes your profit without tanking sales volume.
Optimize Your Product Portfolio
Let's be honest: not all products are created equal. Some of your SKUs are profit-driving workhorses. Others are loss leaders, and some are just plain underperformers dragging your average margin through the mud. A detailed product profitability analysis is absolutely essential.
Contribution margin allows you to rank every single product by its true profitability. This clarity is a total game-changer for your inventory and marketing decisions. You can confidently identify which products to feature in your email campaigns, which ones to bundle for a higher Average Order Value (AOV), and which ones might be candidates for discontinuation.
To really dial this in, investing in the best inventory management software for ecommerce can directly boost your contribution margin by making sure you're always stocked up on your most profitable products.
Imagine getting this kind of AI-driven insight from MetricMosaic: "Your 'Summer Glow' serum has a 72% contribution margin but only accounts for 8% of your ad spend. Consider reallocating budget from the 'Winter Rescue' cream, which has a 34% margin but is consuming 40% of your budget."
This is the kind of actionable, story-driven data that cuts through the complexity and gives you a clear path for growth.
Nail Your Break-Even Analysis
So, how many units do you need to sell each month just to cover your fixed costs like rent and salaries? That's your break-even point, and contribution margin is the key to finding it. The formula is refreshingly simple:
Total Fixed Costs / Contribution Margin Per Unit = Break-Even Point in Units
This analysis is vital for financial planning, setting realistic sales targets, and understanding your risk. If you're planning to hire a new marketing manager (a new fixed cost), you can instantly calculate how many additional sales you need to generate just to cover their salary. It keeps your growth plans firmly grounded in financial reality.
Supercharge Your Marketing Budgeting
For DTC marketers, this is where contribution margin truly shines. Relying solely on Return on Ad Spend (ROAS) is a classic, and costly, mistake. A 4x ROAS sounds fantastic on paper, but if the product you're selling has a razor-thin contribution margin, you could still be losing money hand over fist.
By analyzing contribution margin by marketing channel and campaign, you can measure true profitability. You might discover your Google Ads campaigns deliver a lower ROAS but attract customers who buy high-margin products, making them far more profitable in the long run than a high-ROAS TikTok campaign that just moves low-margin items.
Historically, this focus on margins has been a key driver of economic growth. Delving into global trends, the contribution margin has underpinned a dramatic profit rate evolution over decades. For Shopify brands, this translates to cohort analysis that reveals how healthy contribution margins support a strong Lifetime Value (LTV) and shorten your Customer Acquisition Cost (CAC) payback period. You can read the full UMass ScholarWorks analysis about how profit rates have evolved.
By connecting ad spend directly to contribution margin, an AI platform helps you allocate your budget with surgical precision. You can confidently scale the campaigns that deliver real profit, not just impressive-looking revenue numbers.
Why Gross Margin Is a Trap for Modern DTC Brands
Most Shopify founders I talk to are obsessed with gross margin. And I get it. On the surface, Revenue minus Cost of Goods Sold (COGS) feels like a solid health check. But for a modern DTC brand, relying on gross margin alone is like trying to navigate a city with a map that's missing half the streets.
It tells you how efficiently you make your products, but it completely ignores the massive, variable costs it takes to actually sell them in today's hyper-competitive online world. This blind spot can lead you to make disastrous decisions, pouring cash into what you think are winners, only to find you're bleeding money.
The default reports in your Shopify dashboard, with their heavy focus on gross profit, can easily trick you. You see a product flying off the shelves and assume it's a cash cow, when in reality, it's secretly draining your bank account with every single sale.
The Great Deception of Gross Margin
Gross margin's fatal flaw is what it leaves out. It doesn't account for some of the most critical variable expenses baked into every single DTC transaction.
These are the costs that hit you on every order:
- Payment Processing Fees: That ~2.9% + 30¢ from Shopify Payments or Stripe adds up fast.
- Shipping & Fulfillment Costs: This isn't just the postage. It’s the box, the packing tape, the warehouse labor—all of it.
- Variable Ad Spend: This is the big one. It’s the cost per acquisition from your Meta, Google, or TikTok campaigns.
When you ignore these costs, you’re flying blind. You might scale an ad campaign with a fantastic ROAS, pushing a product with a healthy-looking 60% gross margin, only to discover you're losing money on every order once the true cost of the sale is tallied up.
Gross Margin vs. Contribution Margin: A Tale of Two Numbers
Let's walk through a simple, all-too-common scenario for a DTC brand selling a trendy gadget.
Imagine you sell a smart water bottle for $100.
The Gross Margin View (The Illusion):
- Sale Price: $100
- Cost of Goods Sold (COGS): -$40
- Gross Profit: $60 (a 60% gross margin)
Looks amazing, right? A 60% margin is solid. You’d probably be tempted to pour more ad spend into this product. But now, let's look at the same sale through the lens of contribution margin.
The Contribution Margin View (The Reality):
- Sale Price: $100
- COGS: -$40
- Payment Processing Fee (3%): -$3
- Packaging & Fulfillment: -$7
- Ad Spend (CAC): -$25
- Total Variable Costs: -$75
- Contribution Margin: $25 (a 25% contribution margin ratio)
Suddenly, the picture is radically different. That "highly profitable" product is only generating $25 to cover your fixed costs (like salaries and rent) and hopefully leave some profit. While still positive, it’s a far cry from the $60 you thought you were making.
What if your customer acquisition cost (CAC) had been just $36 instead of $25? This product would have a negative contribution margin, meaning you’d lose $1 with every single sale.
This gap between gross profit and contribution margin is where DTC brands get into trouble. You scale campaigns based on incomplete data, burning through cash while your Shopify dashboard reports record sales.
This isn't just a DTC problem; it's a fundamental principle of value creation. In the wider economy, rising profit margins—which are directly tied to these contribution dynamics—accounted for about 50% of equity returns in the developed world from 1995 to 2019. You can read more about how peak profit margins drive value on Bridgewater.com. For your brand, the lesson is the same: identifying and scaling high-contribution products is what separates sustainable growth from high-revenue bankruptcy.
This is exactly why we built MetricMosaic. It's an AI analytics platform that automatically connects to Shopify, your ad platforms, and your shipping software to give you a real-time, accurate view of your contribution margin—not just the misleading gross margin. It provides the deeper layer of insight you need to make genuinely profitable decisions.
Let AI Handle the Profitability Analysis
We've covered a lot of ground on the what and why of contribution margin. But knowing the formulas is one thing. Actually putting them to work, day in and day out, is a whole other beast.
For most DTC founders, it's a spreadsheet nightmare. You’re pulling reports from Shopify, Google Analytics 4, Meta Ads, your 3PL… then trying to stitch it all together. It’s a slow, soul-crushing process that’s practically designed for human error.
One bad formula or an old ad spend number can trick you into scaling a campaign that's quietly bleeding money. You end up in that classic "data-rich, insight-poor" trap. You're swimming in numbers, but have no clue what they're actually telling you about your profitability.
This is where an AI co-pilot for analytics comes in. It's the bridge between the manual chaos and automated clarity you've been looking for.
From Manual Crunching to Automated Clarity
Think of an AI-powered platform like MetricMosaic as the central nervous system for your brand. It plugs directly into all those scattered data sources, pulling everything together into one, unified source of truth.
No more spreadsheet marathons. You get an instant, accurate picture of your contribution margin, broken down by:
- Product and SKU: Instantly spot your winners and losers.
- Marketing Channel: Finally understand the true profitability of Meta vs. Google vs. TikTok.
- Specific Campaigns: Pinpoint exactly which ads are driving profitable growth and which are just burning cash.
This frees up your most valuable resource—time—and gives you the confidence to make decisions knowing the numbers are always right. If you're curious what this looks like in practice, check out our guide on building a powerful eCommerce analytics dashboard.
The Future Is Conversational and Predictive
But modern analytics is about more than just a slick dashboard. The real magic happens when you can interact with your data as easily as you'd talk to a colleague.
Imagine just asking your analytics platform: "MosaicLive, show me the contribution margin from my latest TikTok campaign compared to last month's." And poof—an instant, visualized answer appears, no reports needed.
That's the power of turning complexity into clarity.
But it gets even better. AI can start giving you predictive insights, forecasting future profitability based on today's trends. It can warn you that a high-margin product is about to sell out or predict the lifetime value of a new customer cohort based on their very first purchase.
You stop reacting to last month's performance and start proactively shaping your future. Your store's data becomes your biggest competitive advantage.
Ready to stop guessing and start knowing your true profitability? MetricMosaic is the AI-powered growth co-pilot for Shopify brands that unifies your data and delivers the actionable insights you need to grow faster. Start your free trial today and see what story-driven analytics can do for your bottom line.