Cómo Calcular el Margen de Contribución para tu Tienda de Shopify
Aprende cómo calcular el margen de contribución para revelar la verdadera rentabilidad de tu tienda de Shopify. Una guía para fundadores sobre cómo tomar decisiones más inteligentes en precios y publicidad.

Si eres fundador de Shopify, conoces la sensación. Tu gráfico de ingresos está subiendo, pero un vistazo rápido al saldo de tu cuenta bancaria no cuenta la misma historia. ¿Realmente está mejorando la salud del negocio? Estás navegando en datos fragmentados de Shopify, Meta Ads y Google Analytics, pero tienes hambre de un número claro que te diga qué está funcionando realmente.
Esta es una trampa clásica para las marcas DTC en crecimiento: confundir el crecimiento de la línea superior con la salud de la línea inferior.
Aquí es donde el margen de contribución se convierte en tu arma secreta. Corta directamente a través del ruido de métricas vanidosas como el Retorno de la Inversión Publicitaria (ROAS) y se enfoca en lo que realmente importa: la rentabilidad de cada venta individual. Aprender cómo calcular el margen de contribución es el primer paso para conectar cada producto que vendes y cada dólar que gastas en marketing directamente con tu ganancia neta.
Al enfocarte en el margen de contribución, pasas de solo rastrear ventas a gestionar estratégicamente la rentabilidad. Es la diferencia entre saber qué vendiste y saber cuánto dinero realmente ganaste con ello.
Esta métrica es la base de un negocio de eCommerce resistente. Para realmente comprender la salud financiera de tu empresa, tienes que mirar más allá de los ingresos y adentrarte en la Planificación y Análisis Financiero (FP&A) estratégico, donde métricas como el margen de contribución son fundamentales. Se trata de tomar decisiones más inteligentes, respaldadas por datos, que impulsen un crecimiento real y sostenible.
En lugar de adivinar, puedes comenzar a responder preguntas críticas con confianza:
- ¿Cuáles de mis productos están realmente financiando el crecimiento de mi negocio?
- ¿Qué campañas publicitarias se ven geniales en papel pero secretamente están drenando mi efectivo?
- ¿Cuánto puedo realmente permitirme gastar para adquirir un cliente para un producto específico y aún así obtener ganancias?
En las siguientes secciones, profundizaremos en los pasos prácticos de este cálculo. También vale la pena aprender sobre otras métricas de rendimiento de eCommerce esenciales que todo fundador debe tener en su radar. Piensa en esto no solo como otro KPI, sino como la base para construir una marca de Shopify más inteligente y rentable.
Llegando a tu Margen de Contribución: Una Guía Práctica
Tener control sobre tu rentabilidad comienza con una fórmula simple, pero el trabajo real está en precisar tus costos variables. Para un fundador ocupado de Shopify, aquí es a menudo donde el análisis se atasca. Los costos variables no son solo tu Costo de Bienes Vendidos (COGS); son cada gasto individual que sube o baja con cada venta que haces.
Cuando lo haces bien, transformas datos financieros abstractos en un camino claro para tomar decisiones más inteligentes.
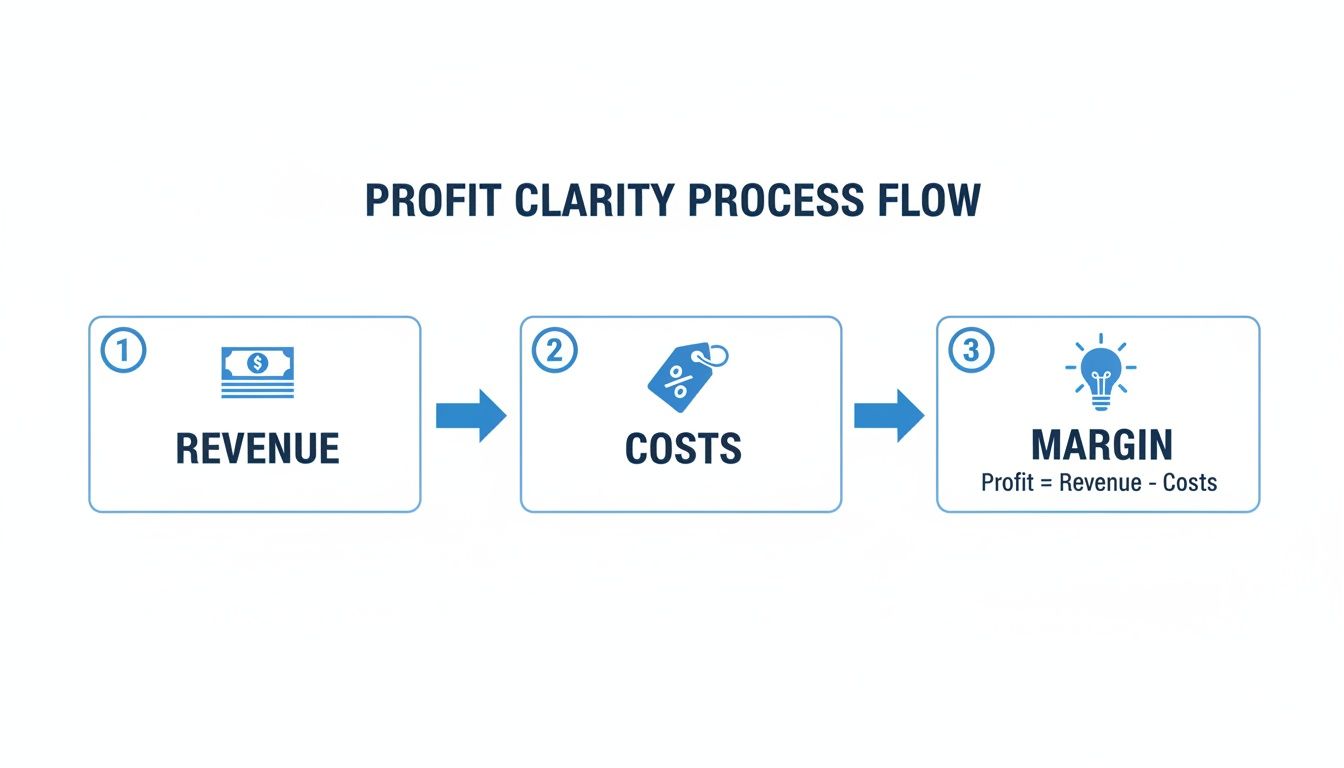
Esta imagen desglosa el viaje hacia la claridad de ganancias. Muestra cómo te mueves desde los ingresos que generas, restas los costos directos vinculados a una venta, y finalmente llegas al margen que realmente impulsa tu negocio. La ganancia verdadera no es solo ingresos—es lo que queda después de cubrir todos los costos de obtener esos ingresos.
Precisando tus Verdaderos Costos Variables
Antes de poder calcular cualquier cosa, necesitas una lista precisa de tus costos variables. Estos son los gastos que fluctúan directamente con tu volumen de ventas. Si vendes una unidad más, estos costos suben. Vendes una menos, bajan. Así de simple.
Clasificar tus costos correctamente es el primer—y más crítico—paso. Muchos fundadores tropiezan aquí al clasificar mal los gastos, lo que distorsiona toda su imagen de rentabilidad. Para ayudar, aquí tienes un desglose rápido de cómo típicamente se clasifican los costos para una tienda de Shopify.
Costos Variables vs Fijos para una Tienda Típica de Shopify
| Categoría de Gastos | Tipo de Costo | Ejemplo |
|---|---|---|
| Costos de Productos | Variable | Costo de Bienes Vendidos (COGS) |
| Comisiones de Transacción | Variable | Comisiones de Shopify Payments, PayPal, Stripe |
| Envío y Cumplimiento | Variable | Comisiones de transportistas, cargos de recolección y empaque 3PL |
| Empaque | Variable | Cajas, sobres, cinta, insertos |
| Comisiones de Ventas | Variable | Pagos de afiliados, comisiones del equipo de ventas |
| Suscripción de Shopify | Fijo | Tu cuota mensual del plan de Shopify |
| Software y Apps | Fijo | Klaviyo, Gorgias, otras herramientas SaaS mensuales |
| Salarios y Sueldos | Fijo | Nómina para tu equipo sin comisiones |
| Alquiler y Servicios | Fijo | Arrendamiento de oficina o almacén, electricidad |
| Marketing (Base) | Fijo | Retainers de agencias, personal de marketing de tiempo completo |
| Gasto Publicitario (PPC) | Variable | Anuncios de costo por clic en plataformas como Meta/Google |
Esta no es una lista exhaustiva, pero cubre los principales. La clave es preguntar: "¿Este costo aumenta si vendo un artículo más?" Si la respuesta es sí, es un costo variable.
Calculando el Margen de Contribución por Unidad
Muy bien, pongamos esto en práctica. Imagina que manejas una marca DTC vendiendo una billetera de cuero premium. Quieres saber exactamente cuánto efectivo cada venta contribuye a cubrir tus costos fijos (como alquiler, salarios y software) y, en última instancia, generar ganancias.
Aquí está el desglose para una sola billetera:
- Precio de Venta: $90
- COGS: $25
- Comisión de Shopify Payments (2.9% + $0.30): $2.91
- Envío y Cumplimiento: $8
- Empaque: $2
Primero, necesitas sumar todos tus costos variables para una unidad: $25 (COGS) + $2.91 (Comisiones) + $8 (Envío) + $2 (Empaque) = $37.91
Ahora, solo colócalo en la fórmula: Margen de Contribución por Unidad = Precio de Venta – Costos Variables Totales por Unidad $90 – $37.91 = $52.09
Este $52.09 es el número mágico. Es el efectivo real que generas de cada billetera vendida—el dinero que ahora puedes usar para pagar todo lo demás en tu negocio.
Llevándolo un Paso Más Allá con la Razón del Margen de Contribución
Mientras que el número por unidad es fantástico para decisiones a nivel de producto, la razón del margen de contribución te da una vista panorámica de tu rentabilidad como porcentaje. Es un cambio de juego para las marcas de Shopify que intentan escalar de manera rentable porque hace que comparar diferentes productos, campañas o canales sea increíblemente simple.
Por ejemplo, digamos que tu tienda de Shopify genera $100,000 en ventas durante un trimestre. Después de sumar los costos variables como COGS ($50,000), envío ($5,000) y comisiones de ventas ($3,000)—que totalizan $58,000—tu margen de contribución llega a $42,000.
Para obtener la razón, solo divides eso por tus ingresos totales: ($42,000 / $100,000) x 100 = un sólido 42%.
Este porcentaje es crucial para comparar rápidamente la rentabilidad sin atascarse en montos específicos en dólares. Para profundizar en más ejemplos y estrategias, puedes aprender más sobre cómo usar la razón del margen de contribución a tu favor.
Convierte tu Margen de Contribución en Decisiones Más Inteligentes
Conocer tus números es una cosa. ¿Realmente usarlos para hacer crecer tu tienda de Shopify? Ese es el verdadero objetivo. Una vez que dominas cómo calcular el margen de contribución, desbloqueas una nueva lente poderosa para tomar decisiones más inteligentes y rentables en toda tu operación DTC.
Esto no se trata solo de contabilidad; se trata de crecimiento estratégico. Finalmente puedes moverte más allá del rastreo superficial de ingresos y comenzar a responder las preguntas que verdaderamente definen la trayectoria de tu marca. Aquí es donde los datos se convierten en tu ventaja competitiva.
Afina tu Estrategia de Precios para la Rentabilidad
Una de las formas más inmediatas de usar el margen de contribución es en tus precios. Tantos fundadores establecen precios basados en lo que están haciendo los competidores o en lo que simplemente "se siente correcto". En su lugar, puedes fundamentar cada decisión de precios en rentabilidad pura.
Conocer tu margen de contribución por unidad te dice exactamente cuánto efectivo genera cada venta de producto. Con esa claridad, puedes probar aumentos de precios con confianza. Un pequeño incremento podría disminuir ligeramente tu tasa de conversión, pero si aumenta significativamente tu margen de contribución por venta, tu rentabilidad general podría dispararse. Esta métrica te da los datos para modelar estos escenarios y encontrar ese punto perfecto entre volumen de ventas y ganancia real.
Supercarga tus Decisiones de Gasto Publicitario
Para cualquier fundador DTC, un ROAS alto en una campaña de Meta o Google Ads se siente como una gran victoria. ¿Pero qué pasa si esa campaña está principalmente impulsando ventas de tus productos de menor margen? Podrías estar escalando un conjunto de anuncios que se ve genial en la superficie pero secretamente está devorando tu línea inferior.
Aquí es donde el análisis del margen de contribución a nivel de campaña cambia completamente el juego.
Al conectar tu gasto publicitario con la ganancia real generada de los productos específicos vendidos, descubres los verdaderos ganadores.
- Identifica Campañas Ganadoras: Finalmente puedes ver qué campañas entregan no solo ingresos, sino ingresos de alto margen. Estas son en las que echas combustible.
- Corta los Perdedores con Confianza: Una campaña podría tener un gran ROAS pero un margen de contribución terrible. Ahora puedes pausarla, sabiendo que no está financiando eficientemente tus costos fijos, y reasignar ese presupuesto con confianza.
El margen de contribución es el suero de la verdad para tu gasto de marketing. Te obliga a mirar más allá de las métricas vanidosas y medir lo que verdaderamente contribuye a la salud de tu negocio, asegurando que cada dólar publicitario trabaje lo más duro posible.
Optimiza tu Portafolio de Productos
Seamos honestos: no todos tus productos son creados igual. Tus datos de margen de contribución casi seguramente revelarán una división clásica 80/20 en tu catálogo, donde un pequeño puñado de SKUs genera la gran mayoría de tu ganancia real.
Esta perspectiva te permite manejar tu portafolio como un estratega experimentado:
- Promociona tus Productos 'Héroe': Estos son tus artículos de alto margen de contribución. Merecen el centro de atención. Preséntalos en tu página de inicio, empújalos en campañas de email y construye campañas publicitarias específicamente alrededor de ellos.
- Maneja tus Productos 'Zombie': Estos son los productos de margen bajo o negativo que solo están ahí, consumiendo espacio de inventario y amarrando efectivo. Con datos claros, puedes tomar una decisión informada para descontinuarlos, agruparlos con productos héroe para elevar el AOV, o encontrar formas de reducir drásticamente sus costos variables.
Entender la verdadera rentabilidad de cada producto es esencial. Para una inmersión más profunda, consulta nuestra guía sobre cómo ejecutar un análisis de rentabilidad de productos para tu tienda de Shopify. Así es como cambias de ser un dueño de tienda reactivo a un arquitecto de crecimiento proactivo, tomando decisiones basadas en datos que consistentemente engrosan tu línea inferior.
Errores Comunes del Margen de Contribución a Evitar
Calcular tu margen de contribución parece simple en la superficie, pero algunos errores comunes pueden convertir esta métrica poderosa en una fuente de datos seriamente engañosos. Para un fundador de Shopify, estos no son solo problemas matemáticos; son el tipo de errores que llevan a escalar campañas publicitarias no rentables o matar un producto que en realidad era una joya oculta.
Hacerlo bien es la diferencia entre confianza basada en datos y simplemente volar a ciegas.

La trampa más grande que vemos es clasificar mal los costos. Es muy tentador agrupar gastos, pero tratar un costo fijo—como tu suscripción mensual de Shopify o un plan de Klaviyo—como un costo variable artificialmente aplastará tu margen de contribución. Esto hace que tus productos se vean mucho menos rentables de lo que realmente son.
Punto Clave: Si un costo no aumenta cuando vendes una unidad más, no es un costo variable. Tienes que ser despiadado sobre mantener los costos fijos y variables separados si quieres que tu proceso de cómo calcular el margen de contribución sea preciso.
Depender de un Solo Margen Mezclado
Otro error demasiado común es mirar solo el margen de contribución general o "mezclado" de tu tienda. Este número único oculta mucha de la verdad sobre lo que realmente está pasando en tu catálogo de productos.
Podrías estar viendo un margen mezclado saludable del 45%, pero eso podría estar sostenido por algunos productos héroe que alcanzan el 70% mientras un montón de productos zombie arrastran el promedio hacia abajo al 10%.
Tomar decisiones importantes basadas en un promedio es una receta para el desastre. Necesitas perspectivas granulares a nivel de producto para saber qué SKUs empujar y cuáles cortar. Aquí es exactamente donde las hojas de cálculo manuales fallan y las plataformas de análisis impulsadas por IA brillan al desglosar automáticamente la rentabilidad por producto, variante e incluso canal de marketing.
Olvidar las Devoluciones y Descuentos
¿Ese número de ingresos de primera línea en tu tablero de Shopify? No siempre son los ingresos que realmente llegas a conservar. Cuando calculas el margen de contribución, tienes que comenzar con tus ingresos netos, lo que significa contabilizar todas esas devoluciones, reembolsos y códigos de descuento.
Olvidar este paso infla tu cifra de ingresos inicial y, como resultado, tu margen final. Siempre resta estos de tus ventas brutas primero para obtener una imagen honesta de tu rentabilidad real.
Ignorar el Contexto y los Períodos de Tiempo
Finalmente, comparar márgenes a través de diferentes períodos de tiempo sin ningún contexto puede ser increíblemente engañoso. Tu margen durante una venta de Black Friday, con descuentos profundos y gasto publicitario por las nubes, va a verse completamente diferente de un mes lento en febrero.
Este tipo de error sesga las perspectivas gravemente. De hecho, una encuesta de 2022 encontró que comparar picos navideños con calmas tranquilas sin el contexto apropiado llevó al 22% de las marcas a sobreestimar su rentabilidad.
Por esto construimos la funcionalidad MosaicLive en MetricMosaic. Unifica datos de fuentes como Klaviyo y Meta Ads para darte vistas instantáneas y ricas en contexto de diferentes cohortes. Esto puede revelar tendencias cruciales—como una erosión de margen del 15% de un segmento de clientes VIP que se está yendo—que una simple comparación fuera de contexto perdería totalmente. Puedes leer más sobre la importancia de datos de margen precisos para tomar decisiones comerciales sólidas.
De Hojas de Cálculo Manuales a Claridad Impulsada por IA
Seamos honestos. Luchar con hojas de cálculo para averiguar tu margen de contribución es un desastre que aplasta el alma y es propenso a errores. Simplemente no escala. Todo ese tiempo que inviertes exportando CSVs de Shopify, Meta Ads y tu software de envío es tiempo que no estás gastando en realmente hacer crecer tu negocio.
Esta rutina manual de datos es un cuello de botella serio. Te mantiene atascado mirando por el espejo retrovisor, reaccionando a números viejos en lugar de dar forma a lo que viene después.
Aquí es donde el juego cambia. Una plataforma impulsada por IA voltea completamente el guión, convirtiendo una tarea tediosa en una conversación simple.

Y esto no es alguna fantasía lejana. Es exactamente cómo las marcas DTC más inteligentes están operando ahora mismo. En lugar de atascarse construyendo fórmulas complejas, llegas a enfocarte en hacer las preguntas correctas.
De Cálculos Manuales a Perspectivas Conversacionales
Imagina solo hacer preguntas a tus datos en inglés simple. Esa es toda la idea detrás de los análisis conversacionales, que está en el núcleo de una plataforma como MetricMosaic. Olvídate de pasar horas sacando reportes. Solo preguntas:
- "¿Cuál fue el margen de contribución para nuestra nueva línea de productos el mes pasado?"
- "¿Qué campaña publicitaria impulsó el margen de contribución más alto?"
- "Muéstrame la rentabilidad de nuestros 10 SKUs principales, después de todos los costos variables."
La IA hace el trabajo pesado. Automáticamente reúne y da sentido a datos de todas tus fuentes clave—Shopify, plataformas publicitarias como Meta y Google, software de envío, tus procesadores de pago—para calcular tus márgenes en tiempo real. Esto evita completamente el riesgo de error manual y libera incontables horas.
Para aquellos que quieren mejorar su juego de hojas de cálculo, también vale la pena ver cómo usar Copilot en Excel puede automatizar algo de este trabajo de fórmulas directamente dentro del entorno que ya conoces.
La verdadera magia: La IA transforma tus datos dispersos de la tienda en una historia clara y cohesiva sobre tu rentabilidad. Incluso puede sacar a la superficie perspectivas predictivas, como qué segmentos de clientes se están volviendo menos rentables, dándote una oportunidad de actuar antes de que se convierta en un problema real.
Este enfoque te ayuda a moverte más allá de solo saber cómo calcular el margen de contribución y entrar en un estado de optimización continua e informada.
De Reportes Reactivos a Crecimiento Proactivo
Cuando tus datos de rentabilidad están automatizados y disponibles instantáneamente, toda tu estrategia cambia. Ya no estás mirando los números del mes pasado tratando de averiguar qué salió mal. Estás viendo lo que está pasando ahora mismo para decidir qué hacer después.
Así es como construyes una verdadera ventaja competitiva. Automatizar tu análisis de rentabilidad te permite hacer llamadas más rápidas e inteligentes sobre precios, gasto de marketing y estrategia de productos.
Para ver cómo todo esto encaja, echa un vistazo a cómo un tablero de análisis de eCommerce unificado crea una única fuente de verdad para toda tu operación. Esta es la diferencia entre solo dirigir tu negocio y verdaderamente liderarlo con datos.
Tus Preguntas sobre Margen de Contribución Respondidas
Muy bien, hemos recorrido las fórmulas y cómo ponerlas a trabajar. Pero sé por experiencia que una vez que comienzas a profundizar en los números, siempre surgen algunas preguntas clave. Abordemos las que escucho más a menudo de fundadores tratando de tener un control real de su rentabilidad.
¿Cuál es una Buena Razón de Margen de Contribución para una Marca DTC?
Esta es la grande, y la respuesta honesta es: depende. Para la mayoría de las marcas que venden productos físicos, apuntar a una razón de margen de contribución del 40-60% es un objetivo sólido y saludable. Si estás en el negocio de bienes digitales—piensa en cursos o software—tus costos variables son mucho más bajos, así que a menudo puedes ver ese número subir muy por encima del 70%.
Pero aquí está lo que realmente importa: no te obsesiones con un punto de referencia universal. El verdadero poder viene de rastrear tu propia razón a lo largo del tiempo. ¿Está mejorando? ¿Cómo se compara con el trimestre pasado? Segmentar esto por categoría de producto es donde está el oro, mostrándote qué partes de tu negocio están verdaderamente impulsando las ganancias.
¿Cómo se Relaciona el Margen de Contribución con el LTV?
Piensa en ellos como dos lados de la misma moneda de rentabilidad. Un margen de contribución más alto en cada pedido alimenta directamente un Valor de Vida (LTV) más alto. Es simple, realmente—cuando cada compra que hace un cliente es más rentable, su valor total para tu negocio crece mucho, mucho más rápido.
Por esto enfocarse en el margen de contribución es una palanca tan poderosa. Es cómo mejoras directamente tu razón LTV a CAC, que es posiblemente una de las métricas más vitales para el crecimiento sostenible. Asegura que estés construyendo tu estrategia de adquisición sobre una base de ganancia real, no solo ingresos.
¿Puedo Usar el Margen de Contribución para Análisis de Punto de Equilibrio?
Absolutamente. De hecho, es uno de sus usos más prácticos para cualquier tienda de comercio electrónico. Corta a través del ruido y te dice exactamente qué necesitas vender para cubrir todos tus costos antes de comenzar a realmente obtener ganancias.
Aquí está cómo calcularlo rápidamente:
- Para encontrar tu punto de equilibrio en unidades, solo divide tus costos fijos totales por tu margen de contribución por unidad.
- Para encontrar tu punto de equilibrio en ingresos, divide tus costos fijos totales por tu razón de margen de contribución.
Deja de perseguir métricas vanidosas y comienza a construir una marca más rentable. MetricMosaic unifica todos tus datos para entregar perspectivas automatizadas, impulsadas por historias, que conectan cada decisión con tu línea inferior. Comienza tu prueba gratuita hoy.