Turning Data Into Actionable Insights for Shopify Growth
Stop guessing. This guide provides a proven framework for turning data into actionable insights to boost ROAS and profitability for your Shopify store.
Let’s be honest, turning a mountain of Shopify data into something that actually makes you money is the whole game. You're swimming in reports from Shopify, Meta, and Google, but you're still left with fragmented data and unclear ROI. It's about getting past the sea of dashboards and finally getting clear answers to the questions that keep you up at night, like "Which ad campaign is actually worth scaling?" or "Are my best customers about to leave me?".
When you get this right, all that overwhelming data becomes your sharpest competitive edge.
Your Shopify Store Is a Goldmine of Unused Data
If you're running a Shopify store, you know the feeling. You're practically drowning in data but starving for actual insight. You've got dashboards in Shopify, Google Analytics, Meta Ads, and Klaviyo, but the complete picture is a fragmented, confusing mess.
You’re surrounded by metrics—ROAS, CAC, AOV, LTV—but using them to make a confident decision? That feels like a constant uphill battle.
This isn’t your fault. It's a symptom of a broken process. For years, the only way forward was to manually export CSVs, wrestle them into spreadsheets, and pray you could spot a trend. That's not just slow and full of errors; it's a model that completely breaks down at the speed of modern DTC.
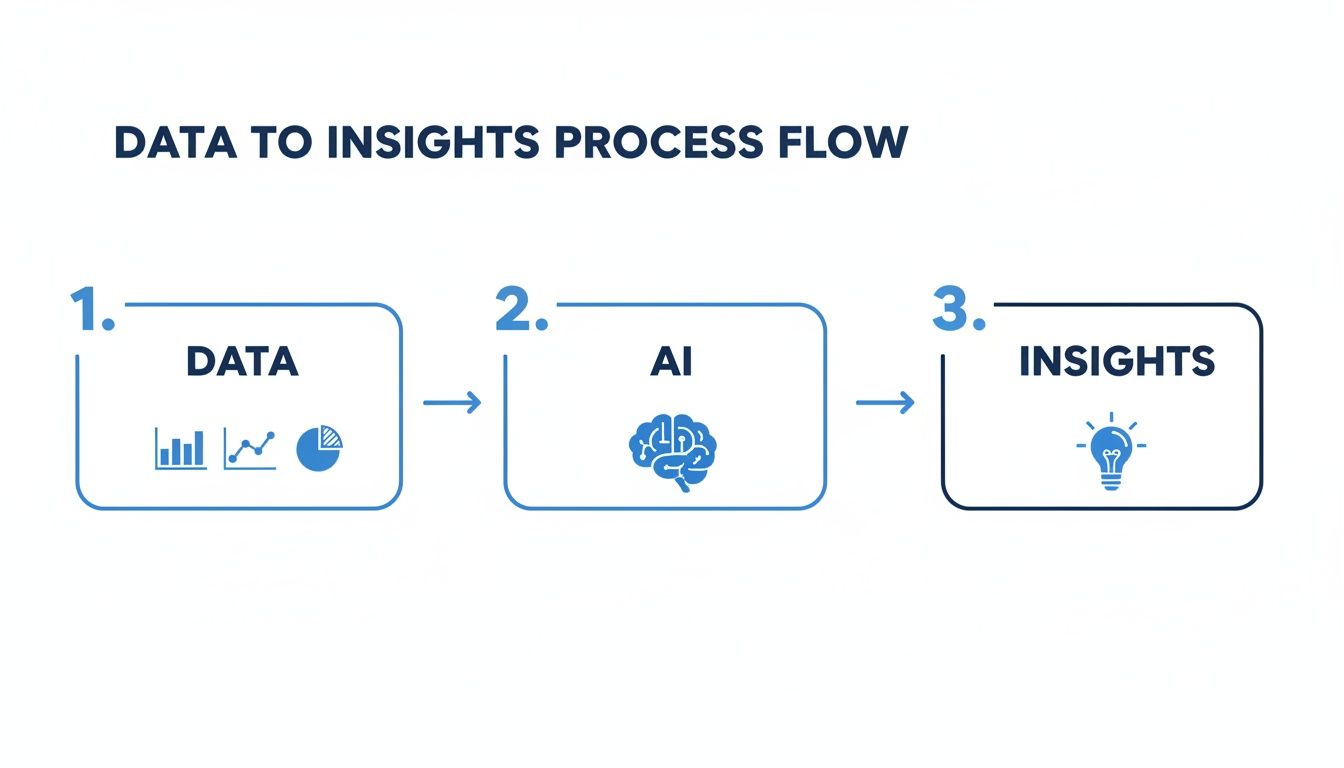
From Manual Crunching to AI-Powered Clarity
The modern way to turn data into actionable insights isn't about building more complicated reports. It’s about getting straight answers to your most important questions, fast.
This is exactly where AI-powered analytics changes things for Shopify brands. Instead of you digging for insights, next-generation tools do the heavy lifting by:
- Unifying all your data automatically, connecting Shopify, marketing channels, and email platforms into one clean, cohesive view.
- Answering questions in plain English, so you can ask something like, "What was our true profitability last month?" and get an instant answer without needing a data scientist.
- Proactively finding opportunities, using AI to generate story-driven insights that tell you precisely where to focus for the biggest impact on ROAS, LTV, and profitability.
The reality for growing DTC brands is that you don't need more dashboards; you need fewer, better decisions. The right analytics tool should feel less like a reporting suite and more like a seasoned growth strategist on your team.
This shift isn't just a small trend; it's a fundamental change in how the best eCommerce businesses operate. The global market for data analytics is absolutely exploding, driven by founders who demand real ROI from their data. In fact, the industry is projected to grow from USD 64.75 billion in 2025 to a staggering USD 785.62 billion by 2035, with a compound annual growth rate (CAGR) of 28.35%. You can explore the full data analytics market research to see just how massive this shift is.
This framework is your blueprint for getting out of the data chaos for good. It's about building a system where every click, purchase, and ad impression—your first-party data—fuels smarter decisions that directly grow your bottom line. We're going to break down exactly how to build this system, turning your Shopify store's untapped data into a powerful engine for profitable growth.
Building Your eCommerce Data Foundation
Before you can turn Shopify data into actionable insights that boost your profitability, you need to get your house in order. Think of it like building a house—you can't put up walls on a shaky foundation. For a DTC brand, that foundation is your data plumbing: the automated system that pulls together, cleans up, and organizes all the messy information from every corner of your business.
Without it, you’re stuck in a nightmare of fragmented reports where nothing quite lines up. You’ve got one story from Meta Ads, a totally different one from Shopify, and who knows what Google Analytics is saying. The only way to break free from this chaos is to ditch the manual spreadsheets and build a single, unified view of what’s actually happening.
The goal isn't just to collect data, but to create a straight line from raw numbers to smart decisions that improve key metrics like CAC and AOV.
The Four Pillars of eCommerce Growth
A solid data foundation really comes down to four essential pillars. As a Shopify operator, it's helpful to think of them this way because they map directly to the customer journey and give you a clear mental model for organizing your data.
Let's break down what each one covers.
| Data Pillar | Key Metrics | Core Question Answered |
|---|---|---|
| Acquisition | CAC, ROAS, Blended ROAS | Where are my customers coming from, and what does it cost to get them? |
| Conversion | CVR, AOV, Cart Abandonment Rate | How well do we turn clicks into cash once they're on our site? |
| Retention | LTV, Repeat Purchase Rate, Churn Rate | Are our customers coming back for more? |
| Profitability | Gross Margin, Contribution Margin, Net Profit | After all is said and done, are we actually making money? |
By tracking these four areas, you get a complete, 360-degree view of your business health, from the first ad click all the way to net profit.
Unpacking the Four Pillars
1. Acquisition: Where Are Customers Coming From?
This is the top of your funnel. It's all about understanding how you attract visitors and, crucially, how much it costs to acquire them. The goal here is to connect your ad spend directly to its outcomes.
- Platforms to Connect: Meta Ads, Google Ads, TikTok Ads, Google Analytics 4 (GA4).
- Essential Metrics: Customer Acquisition Cost (CAC), Return on Ad Spend (ROAS), and blended ROAS (to see the whole picture).
2. Conversion: Turning Clicks Into Cash
Once a visitor lands on your site, this pillar tracks their journey to purchase. It’s all about optimizing that experience to squeeze every last drop of value out of your traffic.
- Platform to Connect: Your Shopify store is the heart of this pillar.
- Essential Metrics: Conversion Rate (CVR), Average Order Value (AOV), and Cart Abandonment Rate.
The real magic happens when you unify these first two pillars. An AI-powered analytics platform can automatically show you which specific ad from Meta is driving the highest AOV on Shopify—a connection that's almost impossible to spot when you're jumping between separate dashboards.
3. Retention: Are Customers Coming Back?
Acquiring a new customer is expensive; getting an existing one to buy again is where the real profit is. This pillar focuses on what happens after the first purchase to build long-term relationships and increase LTV.
- Platforms to Connect: Klaviyo (or your ESP), Shopify, and any subscription or loyalty apps you use.
- Essential Metrics: Customer Lifetime Value (LTV), Repeat Purchase Rate, and Churn Rate.
4. Profitability: Are You Actually Making Money?
This is it. The ultimate source of truth. It cuts through vanity metrics like revenue to reveal your true financial health and answers the most important question for any Shopify founder.
- Platforms to Connect: All of the above, plus any tools for Cost of Goods Sold (COGS).
- Essential Metrics: Gross Margin, Contribution Margin, and Net Profit.
Automating Your Single Source of Truth
Let's be real: manually exporting CSVs from all these platforms isn't just a headache; it's a recipe for disaster. You’re guaranteed to run into data entry errors, mismatched date ranges, and conflicting attribution models that create a funhouse mirror version of your performance.
This is where next-gen analytics platforms like MetricMosaic are no longer a nice-to-have, but a must-have for any serious Shopify brand. They automate that messy data plumbing by connecting directly to the APIs of Shopify, Meta, GA4, and Klaviyo. The system pulls everything into one reliable source of truth, no manual work required. It’s the only way to ensure the data integrity you need for trustworthy insights.
With this foundation in place, you can finally move from guessing to knowing. If you want to dig deeper, check out our guide on building the ultimate Shopify analytics dashboard.
Now, let's look at how AI uses this unified data to find opportunities you might otherwise miss.
From Analysis to Action: How AI Delivers True Insights
Alright, with a solid, reliable data foundation in place, you can finally stop wrestling with spreadsheets and start actually growing your business. This is where the fun begins. It's time to dig in and start turning data into actionable insights by asking better questions.
Forget staring at a static dashboard, hoping for some kind of divine intervention. Modern analysis, especially when supercharged by AI, is dynamic. It's conversational. It's about spotting the hidden patterns that point directly to your next big growth lever to improve ROAS or LTV.

Go Beyond Reports with Conversational Analytics
The first big mindset shift is moving from passive reporting to an active conversation with your data. Seriously. Imagine just asking your data complex questions in plain English, the same way you’d ask a colleague on Slack.
Instead of spending hours clicking through filters and trying to cross-reference multiple reports, you get immediate answers to the questions that actually matter to a DTC operator:
- "Which marketing channel is bringing in first-time buyers with the best 90-day LTV?"
- "Show me the conversion rate for customers who came from our last TikTok campaign."
- "What was our blended ROAS last Tuesday versus the Tuesday before?"
This isn't some far-off concept; it’s a next-gen trend happening right now. An AI-powered tool like MetricMosaic essentially acts as a co-pilot for your Shopify store. It understands the context of your business and instantly pulls the right data from Shopify, Meta, and GA4 to give you a trustworthy answer. That simple change saves hours of manual work and makes data accessible to everyone on your team, not just the "data person."
See the Future with Predictive Insights
Conversational analytics is fantastic for understanding what happened and what's happening now. But predictive insights are all about preparing for what comes next. This is where AI models look at your historical data to forecast what’s likely to happen, letting you move from reactive decisions to proactive strategy.
North America is leading the charge here, projected to grab 32.10% of the global data analytics market share in 2025. Predictive analytics is the biggest piece of that pie, valued at a massive USD 27,899.8 million in 2024. Why? Because it gives growth marketers a huge edge. It lets them forecast customer lifetime value (CLTV) and churn with stunning accuracy, replacing guesswork with data-backed strategies for everything from optimizing ROAS to personalizing Klaviyo flows.
For your Shopify brand, this means you can:
- Forecast LTV: AI can predict the future value of new customer cohorts based on their initial behavior. This helps you set smarter CAC targets built for long-term profitability, not just a quick sale.
- Identify At-Risk Segments: The system can flag customers showing early signs of churning before they actually leave. This opens up a critical window for you to jump in with a targeted win-back campaign to improve retention.
This isn't about having a crystal ball. It’s about using statistical models to make highly educated guesses, giving you the ability to act on opportunities and threats before your competitors even see them coming.
This AI-driven approach transforms complexity into clarity, making advanced analytics accessible to Shopify founders who need to move fast.
Let AI Surface Opportunities with Story-Driven Insights
Maybe the most powerful application of AI is its ability to proactively find opportunities and serve them up as simple, actionable stories. As a founder or marketer, you don't have time to go on a data treasure hunt every single day. A story-driven analytics engine does the hunting for you.
This kind of system is always on, monitoring your key metrics across Shopify, Meta, Klaviyo, and more. When it spots a significant trend, an odd anomaly, or a clear opportunity, it doesn't just ping you with a chart. It actually builds a narrative that explains what's happening, why it matters, and what you should do next.
Here are a few practical examples of what that looks like:
- The High-Performing Ad: "Your 'Summer Glow' campaign on Instagram is crushing it with a 3.2x ROAS and a 25% lower CAC than other ad sets. Recommendation: Shift more budget to this campaign to maximize your returns."
- The AOV-Boosting Bundle: "We noticed customers who buy 'Product A' and 'Product B' together have a 40% higher AOV than average. Recommendation: Create an official bundle with a small discount to encourage this."
- The Churn Signal: "Your 60-day repeat purchase rate for customers from Google Ads dropped by 15% this month. Recommendation: Launch a targeted re-engagement flow in Klaviyo for this specific cohort to boost LTV."
These aren't just data points. They are clear, prioritized directives. This is the final piece of the puzzle—closing the loop between analysis and action so you can focus your limited time on the things that will actually move the needle for your business.
How to Prioritize Insights for Maximum Impact
That feeling when you uncover a powerful insight is amazing. But let’s be honest, for any DTC founder, an insight is completely useless until you actually do something with it. And with AI-powered tools surfacing more opportunities than ever, the real bottleneck isn't finding ideas—it's deciding which ones to tackle first without getting completely overwhelmed.
This is where so many Shopify brands get stuck. You've got a list of ten potential improvements, but which one is going to move the needle this quarter? Prioritization is the bridge between a great idea and actual profit. Without a solid framework, you end up chasing vanity metrics or getting lost in "analysis paralysis," where good ideas go to die.
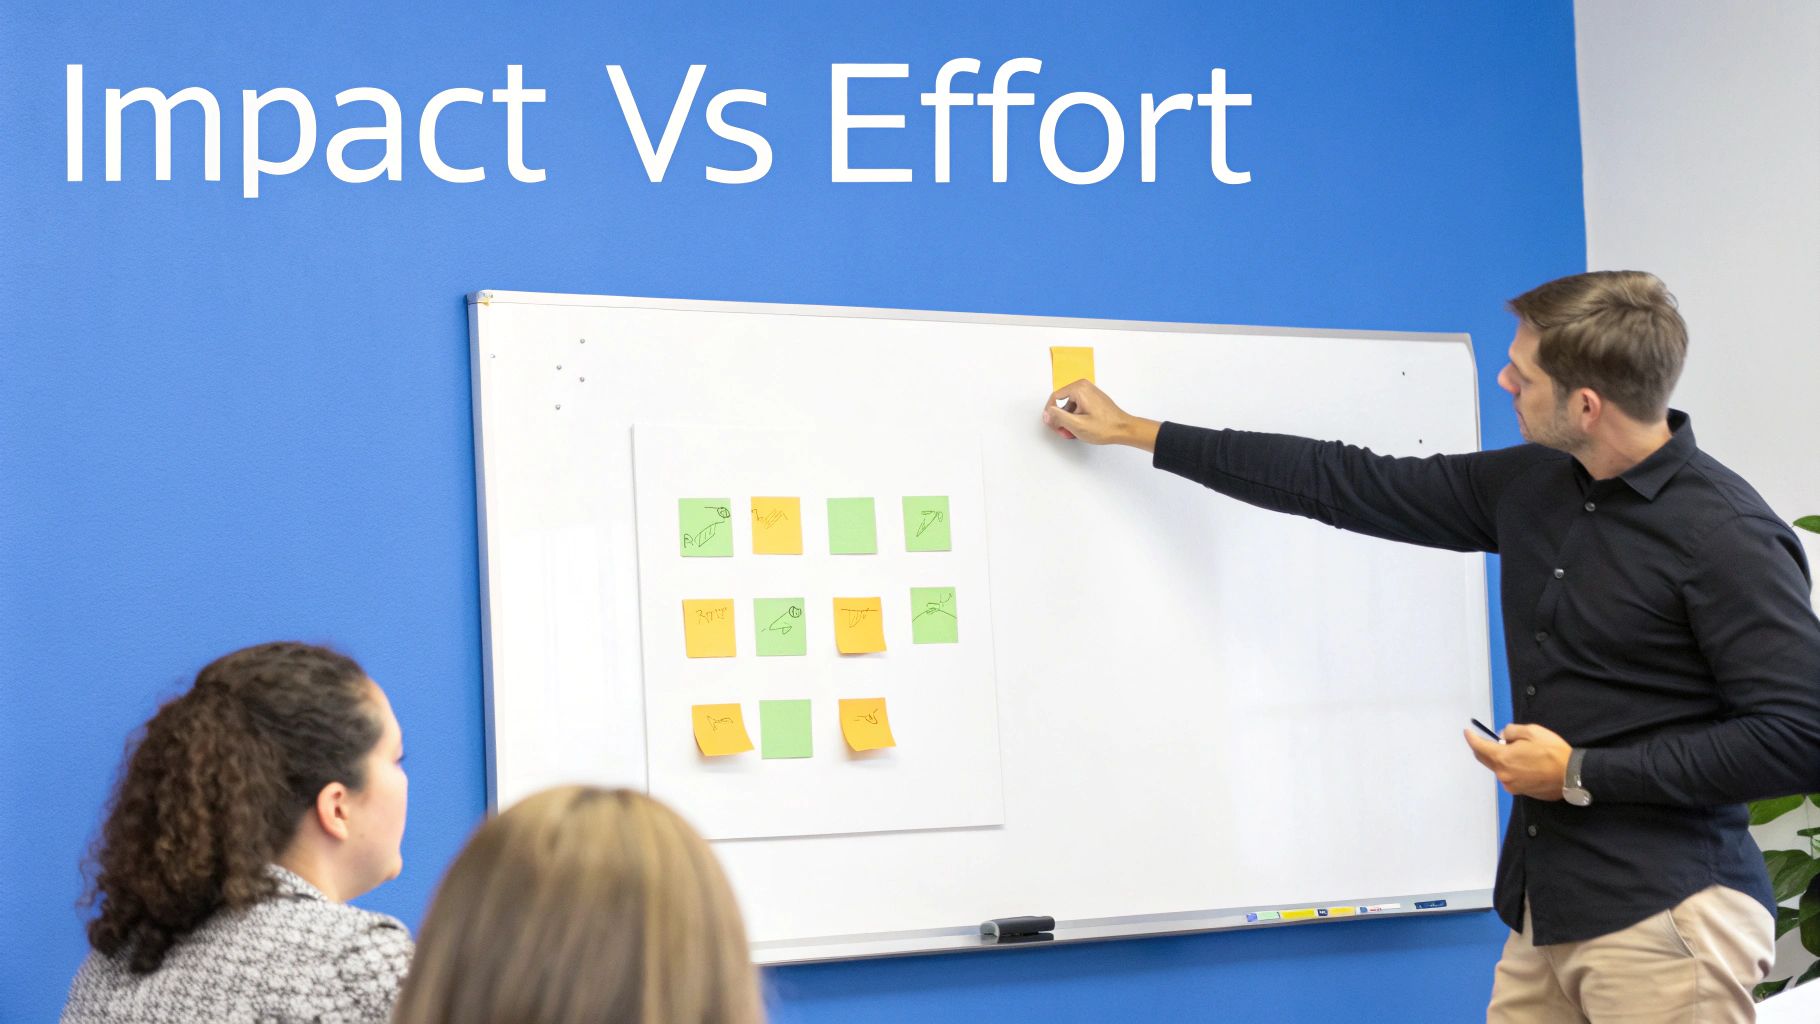
The Impact vs. Effort Framework
The simplest, most effective way I've found to cut through the noise is the Impact vs. Effort model. It's a mental framework that forces you to grade every potential action on two simple scales: how much value will this generate (Impact), and how many resources will it chew up (Effort)?
Think of it like a rapid-fire scoring system for your to-do list.
High Impact, Low Effort: These are your quick wins. They should always be at the top of your list. Found an insight showing a 50% drop-off at a specific checkout step? Fixing a confusing button or simplifying a form is low effort but can have a massive, immediate impact on your conversion rate. Do these now.
High Impact, High Effort: These are the big, strategic projects. We're talking about a complete website redesign or launching an entirely new product line. While they can be absolute game-changers, they need serious planning and resources. Don't ignore them, but schedule them out thoughtfully.
Low Impact, Low Effort: These are the small tweaks that are nice to have but won't fundamentally grow your business. Changing the color of a footer link, for example. Knock these out when you have downtime, but never let them distract you from the bigger wins.
Low Impact, High Effort: Avoid these like the plague. These are the projects that drain resources, kill your team's momentum, and offer almost nothing in return.
By forcing every potential action into one of these four buckets, you bring instant clarity to the chaos. It’s a simple but incredibly powerful way of turning data into actionable insights that are sequenced for maximum results.
A Checklist for Evaluating Your Insights
To really make the Impact vs. Effort framework work, you need to ask the right questions. Before you commit a single resource to a new initiative sparked by a data insight, run it through this quick evaluation.
This simple process helps you move past gut feelings and make a calculated decision.
- What's the real upside? Try to put a number on it. Will this boost AOV by 10%? Could it knock $5 off our CAC? The more specific you can be here, the better your decision will be.
- Does this fit our quarterly goals? An insight might be fascinating, but if it doesn't support your main objectives for the quarter—like improving profitability or increasing LTV—it's just a distraction. A deep understanding of metrics like the contribution margin ratio is crucial for aligning actions with real profit goals.
- What resources will this actually take? Be brutally honest about the effort. Does this need a developer? A designer? How many hours will it pull from your team?
- Can we measure success? If you can't define what success looks like with a clear metric before you start, you'll never know if your action actually worked. Define your key performance indicator (KPI) from day one.
This structured approach is your defense against chasing shiny objects. It ensures your limited resources—time, money, and people—are always focused on the initiatives that will create the most value for your Shopify brand.
Common Pitfalls in Data Analysis and How to Avoid Them
The path from raw data to real revenue is full of traps. It’s a minefield, frankly. Even with the best intentions and the smartest AI tools, it's dangerously easy to chase the wrong numbers, misread the signals, or just get stuck spinning your wheels in analysis paralysis.
Recognizing these traps is the first step. Getting past them is how you build a resilient, data-informed culture that actually turns insights into profit. Falling into them doesn’t mean you’re bad at this; it just means you’re human.
Let's walk through the mistakes I see Shopify founders make all the time and, more importantly, how to sidestep them.
Data Silos and Flawed Attribution
This is probably the biggest one. Your Shopify data lives over here, your Meta Ads data is over there, and your Klaviyo data is on its own separate island. Nothing talks to each other.
The result? A completely fractured picture of your customer’s journey. Your attribution models become little more than a shot in the dark. You might give all the credit to a last-click Google Ad, totally blind to the fact the customer first found you on TikTok three weeks ago.
The Antidote: Unify your data. This is non-negotiable. An automated analytics platform like MetricMosaic is built for this—it connects directly to all your sources via API, breaking down those walls. It becomes your single source of truth, applying a consistent attribution model so you can finally see what’s actually driving sales.
Confirmation Bias and Cherry-Picking Data
We’re all guilty of this. We look for evidence that proves what we already believe. It's called confirmation bias, and in eCommerce, it’s a killer.
It looks like this: you launch a new ad campaign you personally love. You instinctively hunt for a positive metric—like a high click-through rate—to prove it’s working, while conveniently ignoring the sky-high Customer Acquisition Cost (CAC) that’s torching your margins. It’s a dangerous habit that leads to scaling unprofitable campaigns and doubling down on bad decisions.
- The Fix: Approach your data with genuine curiosity, not an agenda. Ask better questions. Instead of, "Is my new campaign a success?" try asking, "Which campaigns from the last 30 days delivered the highest contribution margin?" This forces an objective, profit-first answer.
Ignoring True Profitability
Chasing revenue is the ultimate vanity metric. A $1 million month sounds incredible, right? Not when you find out you spent $950,000 to get there. Too many Shopify brands fall into the trap of optimizing for top-line revenue or ROAS while their true profitability metrics—contribution margin and net profit—are bleeding out.
High ad spend and rising Cost of Goods Sold (COGS) can vaporize your margins, leaving you with a business that’s growing but not actually making any money.
This obsession with profitability is also why the analytics market is shifting so fast. The global data analytics market is on track to hit USD 302 billion by 2030, with a 28.7% CAGR. This isn't just about more charts; it’s about a demand for smarter systems that prescribe profitable actions, not just report on data. You can discover more about this market evolution and what it means for ecommerce.
- The Fix: Get obsessive about contribution margin. You need a crystal-clear, real-time view of your profit after COGS, ad spend, and transaction fees are all accounted for. An AI platform can automatically crunch these numbers for every single order, product, and campaign. This ensures every decision you make is optimized for your bottom line, not just your top line.
A Few Lingering Questions
Even with a solid framework, jumping into the world of AI-powered analytics always brings up a few questions. As a Shopify founder, you don't have time for fluff—you need answers that get straight to the point. Here are a few of the most common ones we hear from DTC brands ready to put their data to work.
What’s the One Metric I Should Be Obsessed With?
This one’s tough because it really depends on what stage your business is in. But if I had to pick just one, it would be Contribution Margin per Order.
This metric is a game-changer. It goes way beyond surface-level numbers like ROAS or AOV to tell you the actual profit you bank on every single sale after all your variable costs are paid. That means COGS, payment processing fees, and—most importantly—the specific ad spend that brought you that customer.
Focusing on contribution margin is how you ensure you're scaling profitably, not just chasing revenue for the sake of it. A good AI-powered analytics tool can track this for you in real-time, showing you exactly which products, channels, and campaigns are actually making you money.
How Can I Get Started with This Stuff Without a Big Team or Budget?
I get it. The good news is you don't need a data science degree or a massive budget anymore. The new wave of AI analytics tools was built specifically for lean teams and founders who wear a dozen different hats.
Look for a platform that’s built for Shopify and offers a free trial. These tools handle all the heavy lifting for you, automatically pulling data from your store, Meta Ads, GA4, and Klaviyo without any manual work on your end.
You can start by just exploring the pre-built dashboards or asking simple, plain-English questions. It's a way to get meaningful insights from day one, without any complex setup or hiring an analyst.
How Often Should I Actually Be Looking at My Data?
The right cadence really depends on the metric. You don't need to check everything with the same frequency—that's a recipe for burnout.
- Daily or Every Other Day: Keep a close eye on your fast-moving acquisition metrics like ROAS and CAC. This lets you react quickly, turning off campaigns that are burning cash and doubling down on what's working before you blow your budget.
- Weekly: For the bigger picture, a weekly check-in is perfect. This is where you look at trends like customer LTV, cohort retention, and overall product profitability. It gives you a strategic view of your store’s health without getting bogged down in daily noise.
Here's the key: find a platform that brings the insights to you. Tools with smart alerts are invaluable. They’ll flag a significant trend or anomaly so you can act on what matters without having to manually dig through dashboards every single day.
My Reports from Shopify, GA4, and Meta Never Match. Which One Is Right?
This is easily one of the most frustrating things for any DTC brand. The honest answer? None of them are "right," and they will never perfectly match. Each platform uses its own attribution model and tracking logic.
Shopify tracks sales in its own world, Meta credits conversions based on its pixel's view of things, and GA4 has its own event-based model. Trying to stitch them together yourself is a losing battle.
The only real fix is a central analytics platform that plugs directly into each data source via API. This platform becomes your single source of truth. It ingests all the raw data and applies one consistent, logical attribution model across everything. It's the only way to get a unified view you can actually trust to make critical business decisions.
Ready to stop guessing and start growing? MetricMosaic is the AI-powered growth co-pilot for Shopify that unifies all your data and delivers the clear, story-driven insights you need to improve profitability. Ditch the spreadsheets and see what your data is really telling you.
Start your free trial today and turn your store's data into your biggest competitive advantage.