How to Measure Customer Engagement for Your Shopify Store
Learn how to measure customer engagement with actionable metrics. This guide helps Shopify brands turn data into loyalty, retention, and profit.
You're a Shopify founder, which means you live in your dashboards. You're tracking sales, watching ROAS like a hawk, and keeping an eye on traffic. But there's a nagging question that keeps you up at night: why do some customers become raving fans who buy again and again, while others purchase once and vanish into the digital ether?
If you're like most DTC brands, you're drowning in fragmented data from Shopify, Google Analytics, and Klaviyo, yet starving for clarity. You can see your session counts, but you can’t quite connect them to your repeat purchase rate. You know your CAC, but you don't know which campaigns are really bringing in high-LTV customers.
This gap is your engagement blind spot, and it's quietly eating into your profitability. This guide is about moving past vanity metrics—like social media likes—to uncover what actually drives repeat business and sustainable growth for a modern DTC brand. We'll show you how AI-powered analytics can finally connect the dots between your Shopify store, your Klaviyo flows, and your ad platforms to turn that complexity into your competitive advantage.
Why Engagement Is Your Most Powerful Growth Lever
Let's be clear: measuring engagement isn't just some academic exercise. For a Shopify brand, it’s the single most powerful lever you have for boosting LTV, improving retention, and building a brand that lasts. Once you truly understand what keeps your customers coming back, you can invest smarter, create marketing that resonates, and build a business that can weather any storm.
Think of it this way: an engaged customer is your best marketing asset. They don't just buy from you; they become part of your growth engine.
These are the customers who will:
- Make repeat purchases, which directly cranks up their Lifetime Value (LTV) and improves profitability.
- Leave positive reviews and tell their friends about you, organically lowering your Customer Acquisition Cost (CAC).
- Give you priceless feedback that helps you nail your product development and perfect your customer experience.
The Shifting Landscape of Customer Loyalty
Earning loyalty in the DTC world is harder than it's ever been. Your customers have endless options, a click away. Their expectations are sky-high.
A single purchase today doesn’t guarantee a relationship tomorrow. Shopify brands have to continuously prove their value and create experiences that make customers feel seen. This is where AI-driven analytics become a game-changer, turning messy data into clear, actionable stories about what your customers truly want.
The data backs this up. One recent analysis showed that only 66% of consumers felt loyal to a brand in 2023. That’s a steep drop from 76% in 2022.
What’s even more telling is that 20% of consumers said brands need to do more to earn their loyalty, a huge jump from just 13% the year before. You can dig into these customer engagement findings on emarsys.com.
This shift means you can't afford to be passive. Proactively measuring and managing engagement is now table stakes. Without a clear picture of how your customers behave after that first purchase, you’re flying blind—probably wasting ad spend on the wrong audiences and definitely missing opportunities to nurture your most valuable shoppers.
This guide will give you the playbook to fix that.
Building Your Engagement Measurement Stack
If you want to really understand customer engagement, looking at a single source of data just won't cut it. The real insights—the ones that drive LTV and ROAS—come when you start connecting the dots between what customers do on your site, how they respond to your marketing, and their actual buying habits. This isn't about needing a data science degree; it's about using AI to build a clear, powerful view from the tools you already use.
The goal is to assemble a cohesive engagement measurement stack. For most DTC brands, this pulls from three core pillars of the business:
- Shopify: The heart of all your transactional data. This is where you find the truth about purchase history, Average Order Value (AOV), and repeat purchase rates.
- Google Analytics (GA4): Your window into on-site behavior. It tells you how people navigate your store, which pages they linger on, and where they drop off.
- Klaviyo: The pulse of your communication. This is where you see how customers interact with your emails and SMS, tracking opens, clicks, and campaign-driven sales.
From Fragmented Data to a Cohesive Narrative
The old way of doing this was a founder's nightmare. You’d wrestle with clunky CSV exports, trying to manually stitch together data in a massive spreadsheet. That approach isn’t just slow and error-prone—it completely misses the bigger story your data is trying to tell. You might see a traffic spike in GA4, but without connecting it to Klaviyo, you have no idea if it came from that new welcome flow you just launched.
This is where next-gen tools are completely changing the game. Instead of you crunching the numbers, AI-powered analytics platforms automate the whole process. They act as a central nervous system, pulling data from each source in real-time and weaving it all into a single, unified customer journey. Fragmented data points suddenly become a clear narrative about how, when, and why your customers engage.
Of course, when you're building out this stack, it helps to understand the quirks of your tools. You need to be aware of potential reporting issues, like why GA4 underreports ChatGPT traffic, to make sure you're making decisions based on the most accurate picture possible.
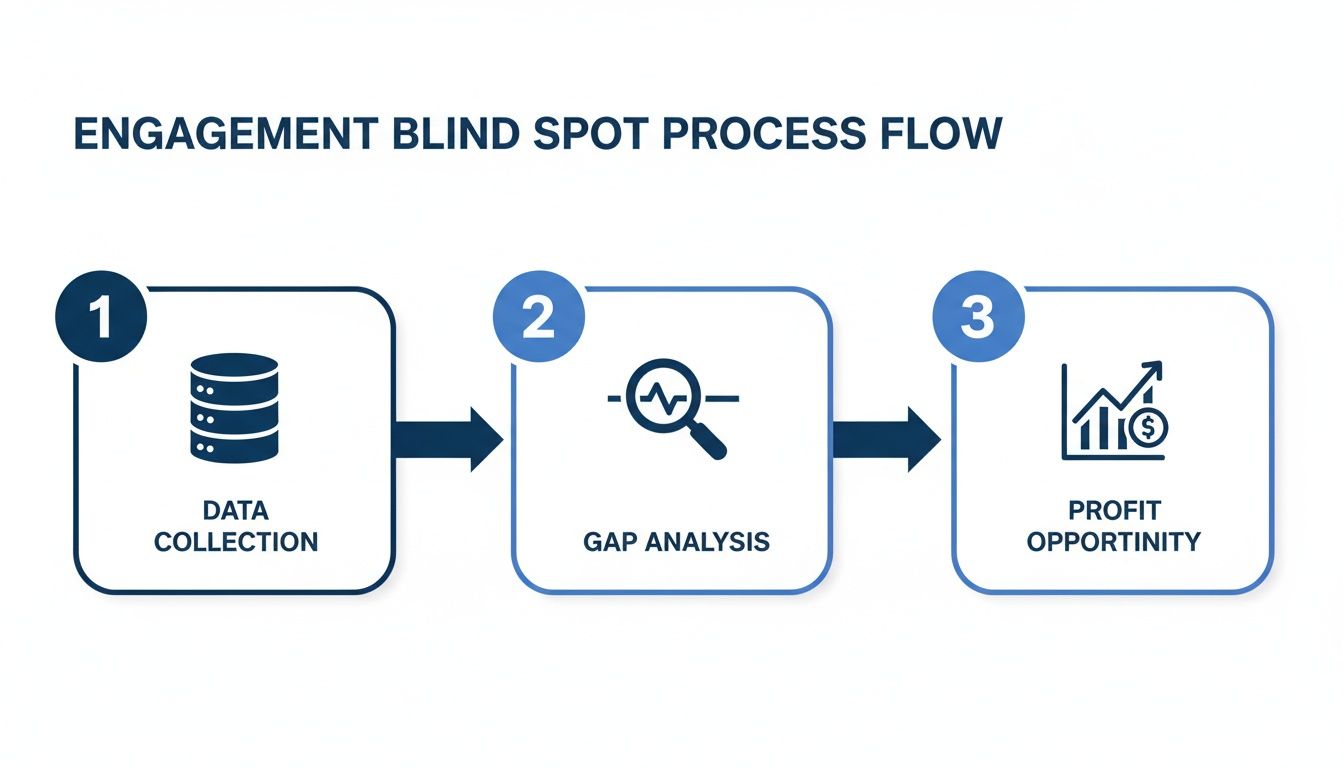
This process is about moving from siloed data to spotting the gaps—which is exactly where the profit opportunities are hiding.
By integrating these platforms, you stop looking at isolated metrics and start seeing a holistic view that directly links your marketing actions to customer behavior and, ultimately, to revenue.
The Power of a Single Source of Truth
Creating this unified view is about so much more than just convenience. It lets you answer the critical growth questions that are nearly impossible to tackle with siloed data:
- Which specific Klaviyo flow brings in customers with the highest LTV in Shopify?
- Do customers who spend more time on product pages (tracked in GA4) actually end up with a higher AOV?
- What was the true impact of that last campaign on both website sessions and repeat purchases?
Trying to answer these questions manually could take a full-time analyst days of painful work. With an automated, AI-driven approach, these insights can be surfaced for you as predictive insights or simple data stories, giving you the clarity to act fast and put your resources where they’ll actually make a difference on your bottom line.
This automated consolidation is the foundation for much deeper analysis. Once your data is unified, you can dive into things like cohort analysis and build a comprehensive ecommerce performance metrics dashboard that gives you a real-time pulse on the health of your business.
The result is a system that doesn't just report numbers, but one that actively helps you grow smarter.
Alright, you've got your measurement stack connected. Now it's time to put it to work. Measuring customer engagement isn't about drowning in dozens of vanity metrics; it's about zeroing in on the handful that give you a real, daily pulse on the health of your brand and directly impact profitability.
For Shopify and DTC brands, the numbers that truly move the needle fall into three buckets: behavioral, transactional, and marketing engagement. These aren't just isolated data points. They weave together to tell the full story of your customer relationships, going way beyond simple traffic and conversion rates to show you the actual loyalty you're building.

Behavioral Engagement Metrics
Think of these as leading indicators. Behavioral metrics show you how people are interacting with your Shopify store before they pull out their wallets. They're clues about what’s grabbing their attention and what's causing them to hesitate.
Product View Frequency: This is simply how many times someone looks at a specific product page. High frequency is a great sign of strong interest. But if it doesn't end in a sale, you might have a problem. For example, if a user views your new serum five times but never adds it to their cart, maybe the price is a bit steep or your product description is missing that one key piece of info.
Session Depth: This measures the average number of pages a visitor checks out in one visit. A deeper session usually means you have a more curious, engaged shopper on your hands. They're not just landing and leaving; they're exploring what your brand is all about.
Add to Cart (ATC) Rate: This is the percentage of visitors who add at least one item to their cart. It’s a make-or-break moment. A low ATC rate, especially on a high-traffic product page, is a huge red flag. It could mean anything from a clunky user experience to a major disconnect between your ad creative and the reality of the landing page.
Transactional Engagement Metrics
This is where the rubber meets the road. Transactional metrics are all about purchase behavior—what customers actually do with their money. These numbers are a direct line to your profitability and long-term health.
The real magic for a DTC brand isn't in the first sale; it's in the second, third, and fourth. Transactional metrics like Repeat Purchase Rate are the clearest signals you have that you're building a brand with staying power, not just a one-hit wonder.
Repeat Purchase Rate (RPR): The percentage of your customers who have come back to buy again. This is one of the most fundamental indicators of product-market fit and genuine loyalty. A rising RPR tells you you're successfully turning one-time buyers into true fans.
Time Between Purchases (TBP): This is the average number of days between a customer's consecutive orders. Nailing this down is critical for timing your marketing perfectly. If you run a coffee subscription and your average TBP is 45 days, sending a replenishment reminder through Klaviyo on day 40 can work wonders for your reorder rate.
Average Order Value (AOV): People often bucket this as just a sales metric, but it’s a fantastic indicator of engagement, too. Customers who trust you and love your products tend to spend more each time they check out. If your AOV is climbing, it’s a good sign that they're exploring more of your catalog and feel confident in your brand. You can dive deeper into how this connects to your overall financial health in our guide to key ecommerce performance metrics.
And speaking of the long game, knowing how to calculate Customer Lifetime Value (LTV) is absolutely essential for understanding what your customers are truly worth over time.
Marketing Engagement Metrics
Finally, these metrics tell you how customers are responding to your direct outreach, especially on channels like email and SMS.
Email Click-Through Rate (CTR): This tracks the percentage of people who actually clicked a link in your email. Open rates are notoriously unreliable these days, but a click is a hard signal of genuine interest. It shows your copy and offers are compelling enough to get someone to take the next step.
Purchase Conversion Rate by Channel: This breaks down the percentage of visitors who buy, sorted by where they came from (like a specific Klaviyo flow or a Meta ad campaign). This is how you find out which channels are bringing you your most valuable, high-intent customers so you can double down on what’s working.
Here’s a quick rundown of the metrics we just covered:
Essential Customer Engagement Metrics for Shopify Stores
A quick-reference guide to the most critical engagement metrics, what they measure, and why they matter for driving profitability.
| Metric | What It Measures | Why It Matters for DTC Brands |
|---|---|---|
| Repeat Purchase Rate (RPR) | The % of customers who make a second purchase. | The ultimate sign of loyalty and product-market fit. |
| Time Between Purchases (TBP) | The average time between a customer's orders. | Crucial for timing your re-engagement campaigns perfectly. |
| Average Order Value (AOV) | The average amount a customer spends per order. | Shows customer trust and willingness to explore your product line. |
| Add to Cart (ATC) Rate | The % of sessions where an item is added to the cart. | A key indicator of purchase intent and site usability. |
| Email Click-Through Rate (CTR) | The % of email recipients who click a link. | A reliable measure of how compelling your marketing messages are. |
Pulling these metrics into a simple, cohesive view gives you a powerful daily snapshot of customer loyalty. Of course, doing this manually is a huge pain. Modern tools like MetricMosaic can automate this entire process, turning scattered numbers into a clear story and highlighting revenue opportunities before you'd ever spot them on your own.
Uncovering Hidden Stories with Cohort Analysis
Store-wide averages are dangerously misleading. Metrics like an average repeat purchase rate are a decent starting point, but they hide the most valuable insights—the stories of how specific customer groups behave over time. This is where you move beyond simple reporting and start asking deeper questions about how to measure customer engagement in a way that actually drives strategy.
The real gold is hidden in cohort analysis.

From Averages to Actionable Narratives
Think of cohort analysis as a storytelling tool for your Shopify store. Instead of looking at all your customers in one giant, messy bucket, you group them into "cohorts" based on a shared characteristic—usually, the month they made their first purchase.
This simple act of segmentation lets you watch their journey unfold over time. Suddenly, you can answer the questions that separate fast-growing DTC brands from everyone else.
- Did the customers we acquired during our big summer sale stick around longer than our Black Friday shoppers?
- Is our product quality improving? Are customers from our January cohort showing better retention than last year's January cohort?
- How did that new onboarding email flow we launched in March impact the repeat purchase rate for that month's new customers?
This is how you get beyond guessing. Imagine discovering that customers acquired through a specific influencer collaboration in May have a 30% higher lifetime value after six months than those who came from a Meta campaign. That single insight is a strategic compass, telling you exactly where to invest your next marketing dollar for maximum long-term profit. If you're new to this concept, our guide on what is a cohort analysis is a great place to start.
Shifting from Manual Drudgery to AI-Powered Clarity
For a long time, running a real cohort analysis meant a painful afternoon wrestling with spreadsheets. You’d have to export massive CSV files from Shopify, manually pivot tables, and try to build visualizations that didn't crash Excel. It was a dreaded, time-consuming task that few founders or marketers had the bandwidth to tackle regularly.
This is exactly the kind of complexity that AI-powered analytics platforms eliminate. Instead of manual data crunching, these tools connect directly to your Shopify and Klaviyo data, automating the entire process.
With a single click, AI can generate clear, intuitive retention curves that instantly show you how each cohort is performing. What once took hours of manual labor now becomes an immediate, actionable story about your brand's health. This shifts cohort analysis from a dreaded report to your go-to strategic tool for boosting LTV and retention.
This speed is critical, especially when it comes to nurturing new customers. Research shows that brands engaging consumers with targeted interactions during the first 30 days post-purchase saw an 83% increase in retention. The best-performing brands hit a 67% 30-day retention rate—a staggering seven times higher than the industry average.
Using Cohorts to Optimize Your Entire Business
Once you have this automated, story-driven view of your customer cohorts, you can start making smarter decisions across the board.
Marketing Spend Optimization: You can allocate your budget with confidence. If the "June 2023" cohort (acquired via a Google Ads campaign) has a terrible retention rate, you know that channel is bringing in low-quality customers. Time to re-evaluate your strategy there and improve your ROAS.
Product & Merchandising Strategy: Are newer cohorts showing a higher Average Order Value (AOV)? That might signal that your recent product launches and cross-selling efforts are hitting the mark. On the flip side, a dip in AOV for a specific cohort could point to an unpopular product bundle.
Customer Experience Improvements: A sudden drop-off in retention for a recent cohort could be a major red flag. Did you change something on your site? Was there a shipping delay issue? Cohort analysis helps you spot these problems early before they poison your entire customer base.
By reframing cohort analysis not as a complex data science project but as a way to uncover hidden stories, you can turn your everyday Shopify data into a powerful competitive advantage.
Turning Engagement Insights Into Revenue
Knowing your numbers is one thing. Actually turning them into more profit for your Shopify store? That's the real challenge. This is the critical step where measurement meets action—where all the cohort stories and engagement metrics stop being report-fodder and start being direct signals on what to do next to improve AOV, LTV, and retention.
Think of each insight as a specific, actionable instruction from your customers. Your data is essentially writing your marketing playbook for you, pointing a giant flashing arrow at the biggest opportunities to drive real, sustainable growth.
Connecting Metrics to Marketing Actions
The real magic happens when you create a direct feedback loop between your analytics and your marketing tools, especially a powerhouse like Klaviyo. When an AI-powered tool spots a meaningful shift in a key metric, it should immediately trigger a strategic response.
This proactive approach transforms your data from a passive dashboard you check once a week into an active growth engine. You're no longer just observing trends; you're shaping them.
Here are a few real-world scenarios I see all the time with Shopify brands:
The Insight: Your "Time Between Purchases" (TBP) for a key customer segment is starting to creep up, stretching from 45 days to 60 days.
- The Action: This is a clear signal to fire up a targeted win-back campaign in Klaviyo. A simple "We miss you!" flow with a compelling offer, sent around day 40, can reactivate these customers before they drift away for good.
The Insight: A cohort you acquired during a holiday sale shows a killer AOV but a disappointingly low repeat purchase rate.
- The Action: This group loves your products but just isn't coming back. They're the perfect segment to introduce to a new loyalty program. Offer them exclusive points or early access to new products to give them a compelling reason to make that second purchase.
The Insight: You notice a group of customers who consistently open your emails but haven't clicked or purchased in over 90 days.
- The Action: These are your "window shoppers." They're still interested but need a nudge. Segment them into a re-engagement campaign that focuses on your brand story, user-generated content, or a special offer to remind them why they fell in love with your brand in the first place.
Don't let your insights die in a spreadsheet. The goal is to build a system where every meaningful data point has a corresponding marketing action. This is how you close the loop between analysis and revenue, making your data work for you every single day.
The Next Wave of Actionable Analytics
This whole process is becoming even more direct with the rise of next-gen, AI-powered analytics. The old way involved finding an insight in one platform, then manually building a segment and campaign in another. The future is about collapsing that workflow entirely.
Imagine just asking your data a question in plain English. That's the promise of conversational analytics. Instead of digging through reports, you get instant, actionable answers.
Founder: "Which products do my most engaged customers—those with at least three purchases—buy together most often?"
AI Co-pilot: "Your most engaged customers frequently purchase 'The Morning Glow Serum' and 'The Overnight Repair Cream' together. We've created a new segment of 850 customers who have purchased one but not the other. Would you like to push this segment to Klaviyo for a cross-sell campaign?"
This isn't some far-off concept; it’s happening right now. This shift eliminates the friction between insight and action, allowing Shopify founders to surface revenue opportunities that were previously buried deep within their store data. It's a fundamental change that turns complex analysis into a simple conversation.
As you get more sophisticated, you can explore concepts like lifetime value modeling to predict which customers will be your most valuable and tailor your actions accordingly.
Ultimately, the entire point of learning how to measure customer engagement is to make smarter, faster, and more profitable decisions. By directly linking your data to your marketing execution, you build a resilient DTC brand that not only understands its customers but also knows exactly how to serve them better.
From Measuring to Managing: Your Next Step
Okay, let's land the plane. Measuring customer engagement isn't about creating prettier reports or getting lost in spreadsheets. For a Shopify founder, it's about building a DTC brand that's more resilient, predictable, and ultimately, more profitable. The real goal is to get from knowing to doing, and you can start right now.
My advice? Don't try to boil the ocean. Pick one core metric from this playbook—maybe it's your Repeat Purchase Rate—and really lean into it for the next 30 days. Focus all your energy on understanding it, tracking it, and launching campaigns to nudge it in the right direction. That single, focused effort will create momentum and prove just how powerful it is to pay attention to the right numbers.
It doesn't take long for a growing Shopify store to outgrow manual tracking. Spreadsheets quickly become a nightmare—they're slow, riddled with errors, and they completely hide the connections between your marketing efforts and the revenue they generate.
This is where you graduate to the final step: using an AI growth co-pilot like MetricMosaic. It automates the entire process, pulling together your data from Shopify, GA4, and Klaviyo without you having to lift a finger.
Instead of fighting with exports and pivot tables, you get a clear, story-driven roadmap that points out exactly where the revenue opportunities are hiding. This is how you make the critical shift from just measuring engagement to actively managing it for real, profitable growth.
A Few Common Questions
When Shopify founders first start digging into their customer engagement analytics, the same few questions always seem to pop up. Let's tackle some of the most common ones I hear.
What's the Single Most Important Customer Engagement Metric for a New Shopify Store?
If you're just starting out, my money is on Repeat Purchase Rate (RPR). Hands down, it’s the clearest, earliest signal you have for product-market fit and whether your customers are genuinely happy.
A rising RPR tells you you're not just a one-hit-wonder burning through ad spend to get one-time buyers. It proves you're building a real customer base with staying power, which is what ultimately drives up your Customer Lifetime Value (LTV) and boosts overall profitability.
How Often Should I Be Looking at My Engagement Metrics?
This really depends on what you're looking at.
Big-picture, strategic metrics like LTV or your cohort retention analysis can be reviewed monthly, maybe even quarterly. You're looking for long-term trends in the health of your brand, not daily blips.
On the other hand, your more tactical metrics need a closer eye. Things like email click-through rates, on-site session duration, or your Add to Cart rate should be checked weekly—especially right after a new product drop or marketing campaign launch. This is where AI-powered analytics tools can be a lifesaver, providing predictive insights that flag significant changes so you're always focused on the numbers that matter right now.
Can I Actually Measure Customer Engagement Without Shelling Out for Expensive Tools?
You absolutely can. You could start by manually pulling data from Shopify and Google Analytics 4 into a spreadsheet. But I’ll be honest: for a busy founder, it’s a soul-crushing amount of work, it's incredibly easy to make a mistake, and it just won’t scale as you grow.
The real power isn't in looking at isolated numbers anyway; it's in connecting the dots between them. Modern AI analytics platforms automate all that data stitching, saving you countless hours and surfacing insights that are nearly impossible to spot on your own. The ROI becomes pretty clear, pretty quickly.
Ready to stop guessing and start growing? See how MetricMosaic turns your store's data into a clear, story-driven roadmap for profitable growth. Start your free trial today.