What is P and L: A Founder's Guide to Reading Your Shopify P&L
what is p and l? Learn what a P&L shows, how to read it, and turn the data into a growth plan for your business.
Let’s be honest. As a Shopify founder, you’re drowning in tasks. You’re managing inventory, tweaking ad campaigns, and putting out customer service fires. The last thing you want to do is stare at a spreadsheet. Financial reports like the Profit and Loss (P&L) statement often feel like a chore—something you quickly scan before handing it off to your accountant.
The problem is, your data is all over the place. You've got numbers in Shopify, Meta Ads, your shipping apps, and a dozen other places. Trying to stitch it all together manually to get a real-time pulse on profitability? It's a recipe for unreliable reports and a dangerous gap between the decisions you make every day and how they actually affect your bottom line.
This fragmented data leads to unclear ROI and a constant feeling that you're guessing, not strategizing. But what if that could change?
Your P&L isn't just a boring record of what already happened. It's the story of your business—a playbook that shows you what’s working, what’s tanking, and where your biggest growth opportunities are hiding.
Instead of a static, rearview-mirror report, imagine a dynamic dashboard that answers your most critical questions on the fly. This is exactly where AI-powered analytics tools come in, turning that overwhelming complexity into crystal clarity. They automate the painful work of pulling all your data together, transforming your P&L from a historical document into a forward-looking GPS for your brand.
Once you truly get what a P&L is and how to read it, you can finally:
- Find Your Real Profitability: See exactly how much cash you're pocketing after subtracting product costs, ad spend, shipping fees, and returns.
- Optimize ROAS and CAC: Tie your campaign costs directly to your net profit to see which ads are actually making you money (and which are just burning cash).
- Improve AOV and LTV: Confidently adjust your pricing, negotiate better rates with suppliers, and put your budget where it will have the biggest impact on profitability.
This guide is here to translate the P&L from accounting-speak into an actionable tool built for the chaos of running a DTC brand. It’s time to stop guessing and start using your data to build a real competitive advantage.
Quick P&L Cheat Sheet for Shopify Founders
To get started, it helps to have a simple way to think about the main pieces of your P&L. I've put together this quick cheat sheet to translate the key line items into what they actually mean for your online store.
| P&L Line Item | What It Means for Your DTC Store |
|---|---|
| Revenue (or Sales) | The total cash you brought in from selling your products on Shopify, before any discounts or returns. This is your top-line number. |
| Cost of Goods Sold (COGS) | The direct cost of the products you sold. Think product manufacturing, raw materials, and inbound shipping to your warehouse. |
| Gross Profit | Your Revenue - COGS. This tells you how much money you have left over to cover all your other business expenses before anything else. |
| Operating Expenses (OpEx) | All the other costs of running your business. For you, this is things like ad spend, Shopify fees, salaries, software, and shipping costs. |
| Net Profit (or Net Income) | The bottom line. This is your Gross Profit - Operating Expenses. It’s the cash you actually get to keep. The real measure of success. |
Think of this table as your go-to reference. As we dive deeper into each section, you can always circle back here to keep the big picture in focus.
Deconstructing Your eCommerce P&L Line by Line
Your eCommerce P&L isn't just a list of numbers; it's the financial story of your Shopify brand. And to really understand that story, you need to get to know the main characters—the line items that take you from your total sales all the way down to your actual, take-home profit.
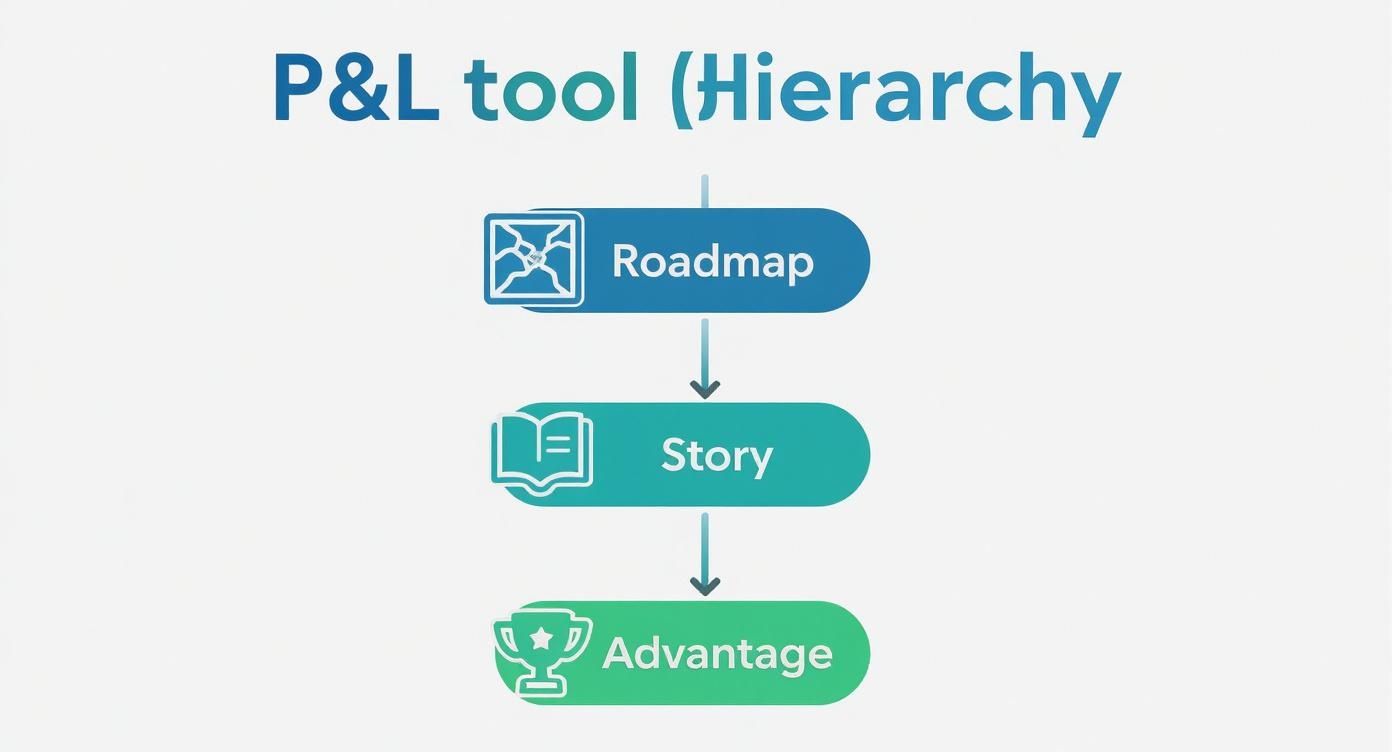
Think of your P&L as a roadmap. It's a strategic tool that tells a story, guiding your decisions and giving your brand a real competitive advantage.
Let's break down the essential components every DTC founder needs to master, starting from the top.
From Top-Line Revenue to Gross Profit
Everything kicks off with Revenue, which you’ll also hear called Gross Sales. This is the total amount of money your Shopify store brought in from sales over a specific period. It's the big, exciting number you see at the top, but it's really just the first chapter.
Right away, you have to subtract sales returns, allowances, and discounts to find your Net Revenue. This number gives you a much more realistic picture of your actual sales volume after the dust settles.
Next up, we calculate Gross Profit, which is simply your Net Revenue - Cost of Goods Sold (COGS). This is one of the most critical metrics for any DTC brand.
Gross Profit is the money left over from every sale after you’ve paid for the product itself. It’s the fuel your business uses to pay for marketing, salaries, and everything else it takes to operate.
So, what exactly makes up your COGS?
- Product Costs: The direct cost of manufacturing or purchasing the goods you sold.
- Inbound Shipping: What it costs to get your products from the supplier to your warehouse or fulfillment center.
- Transaction Fees: Those little bites that payment processors like Shopify Payments or PayPal take.
- Fulfillment Costs: The direct costs of picking, packing, and shipping orders out to your customers.
A healthy Gross Profit is the bedrock of a scalable eCommerce business. Without it, nothing else works.
Unpacking Operating Expenses
Once you’ve got your Gross Profit figured out, it's time to account for your Operating Expenses (OpEx). These are the costs of running the business, even if you don't sell a single product. Think of this as the cost of keeping the lights on and the marketing engine humming.
For a typical Shopify brand, OpEx includes things like:
- Marketing and Advertising: Your spend on Meta, Google, TikTok, and any other channel you’re using.
- Payroll: Salaries and wages for your team.
- Software Subscriptions: Your monthly Shopify plan, plus tools like Klaviyo, Gorgias, and other apps.
- General & Administrative: Rent, office supplies, and professional services like accounting or legal help.
Subtracting OpEx from your Gross Profit gives you Operating Profit (or Operating Income). This tells you how profitable your core business operations are before you factor in things like interest and taxes.
After you subtract those final items, you arrive at Net Profit—the ultimate bottom line. This is the cash you've truly earned, ready to be reinvested into growing your brand.
How to Analyze Your P&L to Find Hidden Profit
A P&L isn't just a scoreboard that tells you if you won or lost last month. For a sharp Shopify founder, it’s a treasure map. Hidden within its lines are clues that point directly to opportunities for boosting your bottom line. Analyzing it correctly is about moving from "what happened?" to "why did it happen and how can we do better?"
Instead of just glancing at the net profit number, the real skill is in understanding the relationships between different line items. AI-powered analytics simplifies this by automatically calculating key ratios and surfacing trends, revealing the true financial health and trajectory of your DTC brand without any manual data crunching.

Key Metrics to Pull From Your P&L
You don't need to be a CPA to pull out actionable insights. Start by tracking these three essential profit margins directly from your P&L data:
Gross Profit Margin: Calculated as
(Gross Profit / Revenue) x 100, this shows the profitability of your products alone. A declining gross margin is a huge red flag, signaling that your product costs or shipping fees are rising faster than your prices.Operating Profit Margin: This is
(Operating Profit / Revenue) x 100. It tells you how efficiently your business is running day-to-day. If this margin is shrinking while your gross margin is stable, it means your operating expenses—like ad spend, salaries, or software subscriptions—are getting out of control.Net Profit Margin: The ultimate indicator of health, calculated as
(Net Profit / Revenue) x 100. This is the percentage of revenue you actually get to keep as profit after every single expense is paid.
Improving these margins is really the name of the game. Interestingly, corporate profit margins in the United States have seen a decisive upward trend over the last few decades. The S&P 500's net profit margin climbed from an average of around 5.85% between 1989–2015 to about 9.75% more recently—a jump of nearly 67%. This highlights just how effectively large firms have managed their profitability levers. You can dig into more insights on this trend over at troweprice.com.
Spotting Red Flags and Opportunities
With these metrics in hand, you can start asking much smarter questions. Your P&L becomes a diagnostic tool for spotting problems before they completely cripple your cash flow.
Your P&L tells a story about every decision you make. A sudden spike in fulfillment costs might reveal an inefficient 3PL partner. A drop in gross margin could mean it’s time to renegotiate with your suppliers or adjust your pricing strategy.
Look for trends over time. Are your COGS creeping up month after month? Is your marketing spend growing but your gross profit isn't keeping pace? This is where you can truly gauge your Marketing Efficiency Ratio (MER) by comparing your total ad spend to your gross profit. It’s a powerful way to see whether your ads are generating profitable growth, not just empty-calorie revenue.
The manual work of tracking these trends across fragmented spreadsheets is where most founders get stuck. This is precisely the problem tools like MetricMosaic solve—automating the consolidation and analysis to surface these story-driven insights instantly, so you can get back to making profit-driving decisions.
Common P&L Pitfalls for Shopify Brands
Knowing what a P&L is and actually creating an accurate one are two very different things. For Shopify founders, the messy reality of DTC eCommerce creates some unique traps that can completely throw off your numbers, leading you to make big decisions with bad data.
The numbers in your Shopify dashboard only tell you part of the story. Without a clean, properly built P&L, you’re basically flying blind. You can't see what's actually driving profit—or what's quietly draining your bank account. These common mistakes are usually the culprits.
Miscategorizing Key Expenses
One of the most frequent slip-ups is putting expenses in the wrong bucket. The classic example? Booking customer shipping costs as an Operating Expense (OpEx) instead of baking them into your Cost of Goods Sold (COGS).
So what's the big deal? It wildly inflates your Gross Profit, making your products look way more profitable than they really are. This one mistake can hide razor-thin margins and trick you into overspending on marketing because you think you have more room for customer acquisition than you actually do.
Key Takeaway: Getting your cost categories right isn't just for your accountant—it's a strategic must. Nailing your COGS is the only way to understand your true profitability at the product level and make smart calls on pricing, promos, and ad spend.
Ignoring the True Cost of Returns
Returns are a painful, but unavoidable, part of the eCommerce game. A lot of founders just look at the lost revenue from a refund, but the real damage to your P&L goes much, much deeper—and it’s often completely untracked.
The cost of a single return isn't just the sale you refunded. It also includes:
- Return Shipping Fees: The cash you pay to get the product back from the customer.
- Restocking Labor: The time your team spends opening the box, inspecting the item, and putting it back in inventory.
- Damaged Goods: Products that come back unsellable, turning into a total loss.
- Original Fulfillment Costs: The money you already spent picking, packing, and shipping the order in the first place.
When you don’t account for all these related costs, your net profit takes a huge hit that never gets properly explained.
Forgetting the "Invisible" Fees
Finally, you have the silent killers: all those tiny transaction fees. They feel like nothing on a single order, but they add up to a monster expense over a month or a quarter. It’s so easy to overlook the combined impact of Shopify Payments fees, PayPal transaction costs, or the small charges from your various Shopify apps.
This is death by a thousand cuts. These fees have to be tracked and plugged into your P&L. If you forget them, you're overstating your net profit and working with a false sense of your real cash position. The first step to building a truly profitable DTC brand is making sure every single dollar—in and out—is accounted for. No exceptions.
From Messy Spreadsheets to AI-Powered Clarity
Let's be honest. The biggest hurdle to using your P&L isn't the concepts—it's the sheer, soul-crushing effort of building one. If you're a Shopify founder, you know the drill: export a CSV from Shopify, another from Google Ads, one from Meta, and a few more from your shipping providers. Then, you spend the next few hours trying to stitch them together in a spreadsheet that feels like it's designed to break.
This manual data-wrangling is slow, tedious, and a breeding ground for errors. You burn hours just building the report, which leaves zero time for the actual analysis that moves the needle. This is precisely where AI-powered analytics platforms are changing the game for DTC brands.
Automating Your Path to Profitability
Next-generation tools like MetricMosaic ditch the manual work entirely. They act as a central hub, automatically syncing with all your critical data sources in real-time. Instead of fighting with spreadsheets, you get a consistently accurate, live P&L without lifting a finger.
This automation fundamentally changes your role. You stop being a data janitor and start being a growth strategist. The hours you used to lose to manual consolidation can now be spent making decisions that actually improve your bottom line.
The goal of modern analytics isn't just to build reports faster. It's to eliminate the report-building process altogether, giving you instant access to the story your data is trying to tell.
The P&L has been a business staple for over a century, but maintaining profitability is getting harder. Global profit rates have been in a slow, steady decline since 1960. A detailed study covering 1981 to 2019 found that the average rate of profit for firms worldwide fell by about 0.09% every year. You can dig into the historical data on scholarworks.umass.edu. This trend makes the speed and precision of an AI-driven P&L more critical than ever for DTC brands trying to swim against the current.
Beyond Reporting to Predictive Insights
But true AI-powered analytics doesn't just show you the numbers. The real magic is in its ability to interpret them for you, serving up predictive insights and a clear narrative. Your platform shouldn't just show you that net profit dropped last month; it should tell you why.
Imagine a system that can:
- Surface the Root Cause: Instantly flag that your net profit dipped because fulfillment costs from a specific carrier jumped 20%.
- Send Proactive Alerts: Notify you the moment your marketing efficiency on a Meta campaign starts to tank, letting you pivot before you burn more cash.
- Forecast Future Performance: Use current AOV and ad spend trends to project your net profit for the next quarter, helping you set targets grounded in reality.
This is the shift from reactive reporting to proactive, conversational analytics. It's about asking plain-English questions and getting immediate, data-backed answers. It turns your P&L from a static, historical document into an active co-pilot for growing your business.
Turning P&L Insights Into Actionable Growth
https://www.youtube.com/embed/hrSUq4wcd0g
Look, understanding your P&L is great, but it's just the first step. The real magic happens when you turn that knowledge into tangible growth. For Shopify founders, this means getting out of the habit of just glancing at last month's numbers and instead, building a proactive, forward-looking strategy.
The goal is to make your P&L the command center for every major business decision.
This shift doesn't have to be complicated. It starts with a simple monthly review framework. Instead of getting bogged down in every single line item, focus on asking a few high-impact questions that tie your P&L directly to your day-to-day operations.
Key Questions for Your Monthly Review
- Is our Net Profit Margin trending up or down? This is your brand’s ultimate health score. If it's slipping, you immediately know you need to dig into your COGS or operating expenses.
- How does our ad spend compare to our Gross Profit? This isn't about ROAS; it's about your true Marketing Efficiency Ratio (MER). Are you just throwing more money at ads while your gross profit stays flat? If so, something's not working.
- Is our CAC sustainable relative to our Gross Profit per order? This is where the rubber meets the road. If it costs you $40 to acquire a customer who only brings in $35 of gross profit, your business model is fundamentally broken.
Your P&L is the single most powerful tool for building a resilient, scalable DTC brand. Each line item tells a story. When you focus on these story-driven insights, you stop being a spectator and start actively managing your brand’s profitability.
Taking a step back, the broader market reinforces just how critical profitability is. Since the 2008 financial crisis, the FTSE All-World index saw a respectable 216% return. But U.S. markets, led by highly profitable companies, absolutely crushed that with a 426% total return. Profitability drives value, period. You can read more on these global equity market trends yourself.
The next step is to stop fighting with spreadsheets and start getting clear, automated answers.
A Few Common Questions
Here are a few quick, clear answers to the most common questions we hear from Shopify founders about wrangling their P&L.
What’s the Difference Between a P&L and a Balance Sheet?
I like to think of it like this: a P&L is a video, and a Balance Sheet is a snapshot.
Your P&L statement (the video) shows you how the business performed over a period of time, like a month or a quarter. It’s the story of your revenue and expenses, leading up to the final scene: your profit or loss for that period.
A Balance Sheet (the snapshot), on the other hand, is a picture of your financial health at a single point in time. It’s a simple equation of what your company owns (assets) versus what it owes (liabilities), giving you a clear look at your net worth on one specific day.
How Often Should I Be Looking at My Shopify Store's P&L?
For most DTC brands, a monthly review is the sweet spot. It’s frequent enough to spot trends and catch issues before they snowball, but not so often that you get lost in the daily noise.
This cadence lets you make smart, timely calls on your marketing budget, inventory levels, and overall strategy.
A monthly P&L review gives you the perfect rhythm. Daily check-ins can make you jumpy and reactive, while waiting three months for a quarterly report feels like an eternity in the fast-moving world of eCommerce.
Should I Use Cash or Accrual Accounting for My P&L?
This one’s a biggie. While cash-basis accounting seems simpler on the surface, accrual-basis accounting gives you a much more honest look at your true profitability.
Here’s why: Accrual accounting logs revenue when you earn it and expenses when you incur them, no matter when the cash actually moves. For a DTC brand, this is critical. It correctly matches the ad spend from May with the sales it generated in May, giving you a real read on your campaign performance.
Using a cash-based method can seriously distort the picture, making it almost impossible to know the true ROI of your efforts.
Ready to stop wrestling with spreadsheets and get a P&L that tells you a story? MetricMosaic connects all your Shopify data to give you a real-time view of your profitability and surfaces the actions you need to take to grow. Start your free trial today.