What is Contribution Margin Ratio? A Simple Guide to Boost DTC Profits
What is contribution margin ratio and why it matters for Shopify brands? Learn a practical approach to boost profitability for DTC founders today.
Your Shopify store's revenue is climbing, but when you check your bank account, the profits feel razor-thin. Where is all the money going? Between COGS, skyrocketing ad spend, shipping fees, and transaction costs, it’s easy to feel busy but not actually profitable. Relying on top-line revenue is like driving with no fuel gauge—you're moving, but you have no idea how close you are to stalling out.
This is where the contribution margin ratio becomes your superpower. For Shopify brands, it's the metric that cuts through the noise to reveal a product's true profitability, not just the revenue it brings in. Think of it as the percentage of every sale left over to pay for your fixed costs—and hopefully, generate profit—after you’ve covered all the variable costs.
A higher ratio is always better. It means more cash from each sale is available to reinvest and grow your business.
Why High Sales Don’t Always Mean High Profits

It’s a story most Shopify founders know by heart. Your revenue chart is finally pointing up and to the right, your social media is buzzing, and the orders are coming in. On the surface, your DTC brand looks like a huge success. But then you check your bank account, and the numbers don't quite add up. Profits are dangerously thin, and you're left scratching your head, wondering where all the money went.
This gap between impressive revenue and disappointing profit is a classic growing pain. As you scale, you're suddenly juggling a dozen different expenses:
- Cost of Goods Sold (COGS) for your most popular items.
- Skyrocketing ad spend on Meta and Google just to get seen.
- Steadily climbing shipping and fulfillment fees.
- Those sneaky transaction fees that chip away at every single order.
This creates a massive profitability blind spot. You’re definitely busy, but are you actually building a profitable business? Relying on top-line revenue alone is like driving a car by only looking at the speedometer. Sure, you know how fast you're going, but you have no clue how much gas is left in the tank.
Moving Beyond Surface-Level Metrics
To build a DTC brand that lasts, you have to look deeper than just sales figures. You need a metric that exposes the financial engine humming behind every single order. This is where understanding the contribution margin ratio becomes your superpower. Instead of spending hours crunching numbers in spreadsheets, AI-powered analytics can instantly calculate this for you, turning fragmented data into clear, actionable insights.
Don't mistake motion for progress. A busy Shopify store isn't always a profitable one. True growth comes from understanding the profitability of each transaction, not just the total volume of sales.
Stop thinking of contribution margin ratio as some boring accounting term. It’s a strategic lens. It tells you exactly what percentage of each dollar you earn is actually available to cover your fixed costs—things like your Shopify subscription, app fees, and salaries—and, most importantly, what’s left over as pure profit.
Without this clarity, you're essentially flying blind. You might be pouring marketing dollars into a "bestseller" that barely breaks even after you factor in ad spend and shipping. Meanwhile, a quieter, slower-moving product could be a hidden profit machine.
This guide will demystify the contribution margin ratio. We'll show you exactly how to calculate it and, more importantly, how to use it to make smarter decisions about your pricing, marketing budget, and product mix. It’s time to stop feeling busy and start being profitable.
Understanding the Contribution Margin Ratio
Let’s cut through the accounting jargon. The contribution margin ratio is simply the percentage of each sale left over to pay your fixed costs—things like rent, salaries, and your Shopify app subscriptions—after you’ve covered all the variable costs tied directly to that sale.
Think of it as a profit fuel gauge for your brand. For every dollar you earn, a chunk of it is immediately spent just to produce and deliver the product (your variable costs). The contribution margin ratio tells you exactly how much of that dollar is left to keep the lights on and, eventually, turn a profit.
A higher ratio means each sale is more powerful, leaving more cash to grow your business. A low ratio, on the other hand, can be a red flag that you’re just spinning your wheels, even if sales look strong on the surface.
The Core Formulas Made Simple
You don’t need an accounting degree for this. There are really only two formulas you need to get a handle on. First, let's find the contribution margin in raw dollars.
Contribution Margin ($) = Total Revenue - Total Variable Costs
This quick calculation shows you the total cash available to cover your fixed expenses. For example, if you sell a t-shirt for $50 and the variable costs (the blank shirt, printing, shipping, payment fees) add up to $20, your contribution margin is a solid $30.
Once you have that dollar amount, turning it into a percentage—the contribution margin ratio—is easy. This is where the real magic happens, because the ratio lets you compare the profitability of different products on a true apples-to-apples basis.
Contribution Margin Ratio (%) = (Contribution Margin / Total Revenue) x 100
Using our t-shirt example, the math looks like this: ($30 / $50) x 100 = 60%. This means that for every dollar you bring in from that t-shirt, 60 cents is left over to pay for your marketing team, your warehouse lease, and your bottom line. This is the kind of powerful metric that AI-powered analytics tools like MetricMosaic track in real-time to uncover hidden profit opportunities.
A Practical eCommerce Example
Let's zoom out and look at the whole business. Imagine your Shopify store pulled in $100,000 in sales last month. After digging into your expenses, you find that the total variable costs—including cost of goods sold (COGS), shipping, and payment processing fees—came to $58,000.
This leaves you with a contribution margin of $42,000. To find the ratio, you just divide that by your total revenue: ($42,000 / $100,000) × 100 = 42%.
That 42% is a crucial number. It tells you that 42 cents of every dollar you earned went directly toward covering fixed costs and generating profit. This is the kind of insight you need to make smart strategic decisions to improve ROAS, CAC, and overall profitability. If you want to dive deeper, you can find a more detailed breakdown of contribution margin for retail businesses.
Getting a grip on this concept is the first step toward moving from just chasing revenue to truly understanding the financial engine of your brand. It empowers you to make data-driven decisions that actually boost your bottom line.
How to Calculate Your Contribution Margin Ratio
Alright, let's move from theory to practice. Figuring out your contribution margin ratio is the first real step toward making smarter, more profitable decisions for your DTC store. The math isn't complicated, but it does demand that you're brutally honest and thorough about your costs. Manually crunching these numbers is tedious; this is where AI simplifies analytics, replacing manual data wrangling with automated, accurate insights.
We'll walk through this step-by-step, using a real-world Shopify product example to make the numbers click. The goal here is to get you comfortable enough to apply this to your own data right away. We’re going to look at it from two essential angles: on a per-unit basis and for your business as a whole.
This visual shows the simple flow of how your revenue gets whittled down to the contribution margin, which is the true engine of your store's profitability.
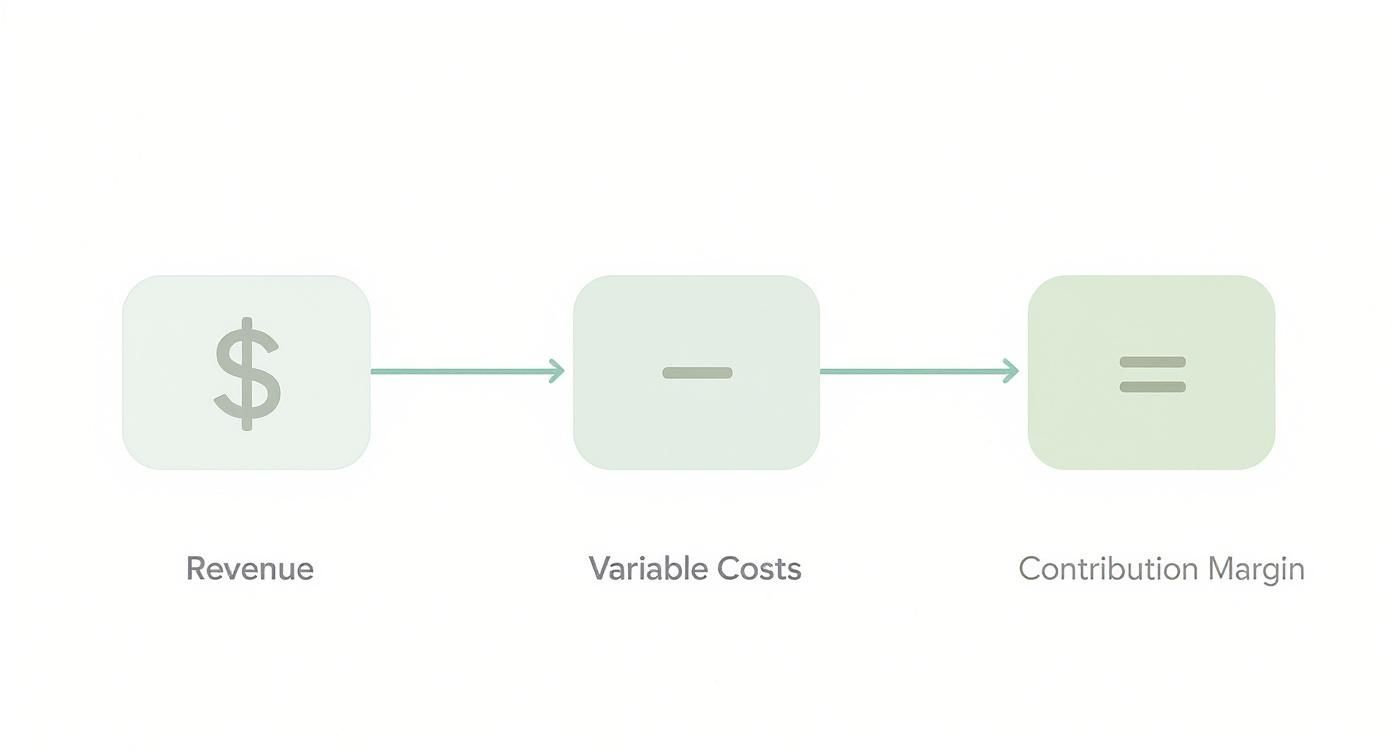
What this really highlights is that your contribution margin is the pot of money left over after paying for everything it took to make and sell a product. This is the cash that has to cover all your other fixed operating costs before you can even think about profit.
Calculating on a Per-Unit Basis
This is where the magic happens. By calculating the contribution margin ratio for individual products, you can finally spot your "profit heroes" and your "margin drainers." It reveals which items are actually bankrolling your growth and which might be secretly costing you money, directly impacting your LTV and retention efforts.
Let's use a tangible example: a specialty skincare serum sold through a Shopify store.
Step 1: Identify the Sale Price This one’s easy. It’s what the customer actually pays for one bottle.
- Sale Price: $75
Step 2: List All Variable Costs Per Unit Pay close attention here, because this is the most critical step. You have to capture every single cost that goes up every time you make a sale. Don't leave anything out.
- Cost of Goods Sold (COGS): This covers the raw ingredients, the bottle, and the label. Let’s say this comes to $12.
- Packaging: Think custom box, filler paper, and any marketing inserts. We'll budget $3 per unit.
- Payment Processing Fees: Shopify Payments and other gateways usually take around 2.9% + $0.30. On a $75 sale, that's about $2.48.
- Shipping & Fulfillment: The actual cost to pick, pack, and ship the order. Let's say this averages out to $8.
- Attributed Ad Spend (CPA): If you know your average cost per acquisition for this specific product, you need to include it. Let’s assume your blended CPA is $15.
Now, just add it all up:
- Total Variable Costs: $12 + $3 + $2.48 + $8 + $15 = $40.48
Step 3: Calculate the Contribution Margin and Ratio Simply subtract your variable costs from your sale price. This is your per-unit contribution margin in dollars.
- Contribution Margin ($): $75 - $40.48 = $34.52
Finally, turn that into a percentage to get the ratio.
- Contribution Margin Ratio (%): ($34.52 / $75) x 100 = 46%
That 46% is a powerful number. It tells you that for every single serum you sell, 46 cents of each dollar in revenue is left to help cover your fixed costs (like rent and salaries) and, eventually, become profit.
Calculating for Your Entire Store
While a per-unit analysis is fantastic for making decisions about specific products, you also need a 30,000-foot view of your store’s overall financial health. The aggregate contribution margin ratio tells you how efficiently your entire business is turning revenue into real money.
Let's imagine your Shopify store brought in $150,000 in total revenue last quarter.
Step 1: Tally Total Variable Costs Now you’ll pull the combined numbers for all your variable costs over that same period.
- Total COGS: $45,000
- Total Packaging Costs: $9,000
- Total Payment Fees: $4,500
- Total Shipping & Fulfillment: $24,000
- Total Marketing Spend (Variable): $30,000
- Total Variable Costs: $112,500
Step 2: Calculate the Total Contribution Margin and Ratio
- Total Contribution Margin ($): $150,000 - $112,500 = $37,500
- Total Contribution Margin Ratio (%): ($37,500 / $150,000) x 100 = 25%
Key Insight: See the difference? Our hero skincare serum had a healthy 46% ratio on its own, but the store-wide ratio was a much lower 25%. This is a massive red flag. It immediately suggests that other products in your catalog might have razor-thin (or even negative) margins, or perhaps your overall marketing spend is dragging down profitability. That’s the kind of critical insight you'd completely miss by only looking at top-line revenue.
Understanding your contribution margin ratio is fundamental for sound financial planning. If you want to dig a bit deeper, you can explore more about how these ratios impact business strategy across different industries.
Of course, crunching these numbers manually is a good start, but it’s slow, tedious, and easy to mess up. This is exactly where AI-powered analytics tools like MetricMosaic come in. They automatically sync data from Shopify, your ad platforms, and shipping software to give you an accurate, real-time picture of profitability at both the product and business level, without any of the manual grunt work.
Using Contribution Margin to Grow Your Brand

Knowing your contribution margin ratio is a great start, but the real magic happens when you turn that number into smarter business decisions. This isn't just a metric for your spreadsheets; it's a strategic tool you can use to drive profitable growth. For a Shopify brand, it's what separates guessing from knowing.
This is where you start connecting the data dots to real-world actions. Let's walk through four powerful ways DTC brands can use the contribution margin ratio to make measurable improvements across pricing, marketing, and product strategy.
Build Smarter Pricing Strategies
Pricing your products can often feel like a shot in the dark. Go too high, and you might scare customers away. Go too low, and you leave money on the table—or worse, lose money on every single sale. Your contribution margin ratio is the antidote to that guesswork.
By understanding the exact percentage of each sale that goes toward covering your fixed costs and generating profit, you can set prices that guarantee a healthy margin from the get-go.
Here’s how it works in practice: Imagine you sell a leather tote bag for $150. After adding up your variable costs (the leather, hardware, shipping, and payment processing fees), you land at $90.
- Contribution Margin: $150 - $90 = $60
- Contribution Margin Ratio: ($60 / $150) x 100 = 40%
Now, if you want to run a promotion, this ratio tells you exactly how much wiggle room you have. A 20% discount drops your price to $120. Your new contribution margin shrinks to $30, and the ratio plummets to 25%. Armed with this data, you can decide if the potential boost in sales volume and AOV is worth the hit to your per-unit profitability.
Optimize Your Marketing Budget
One of the biggest questions every DTC founder wrestles with is, "How much can I actually afford to spend to get a new customer?" Your contribution margin ratio helps you find the answer by calculating two mission-critical marketing metrics.
- Break-Even ROAS (Return on Ad Spend): This is the rock-bottom ROAS you need on your ad campaigns just to cover the cost of the goods you sold. Anything above this number is profit. The formula is beautifully simple: 1 / Contribution Margin Ratio.
- Maximum Allowable CAC (Customer Acquisition Cost): This tells you the absolute most you can spend to acquire a customer on their first purchase without losing money. You calculate it like this: Average Order Value (AOV) x Contribution Margin Ratio.
By linking your contribution margin directly to your marketing KPIs, you stop spending blindly and start investing strategically. You can confidently scale campaigns that are profitable and cut those that are just burning cash.
Evaluate Product Portfolio Health
Here's a hard truth: not all bestsellers are created equal. A product that flies off the shelves but has a razor-thin contribution margin can be a silent drain on your resources. At the same time, a slower-moving item might be a hidden profit hero.
Analyzing the contribution margin ratio for each product in your catalog is like giving your business an MRI. It reveals what's really going on under the surface.
This kind of analysis helps you sort your products into clear categories:
- Profit Heroes: High margin, high volume. Pour your marketing fuel on these.
- Margin Drainers: Low or even negative margin. It's time to consider raising prices, finding cheaper suppliers, or discontinuing them altogether.
- Hidden Gems: High margin, low volume. How can you get more eyes on these? Think about creating bundles or running targeted ads to improve retention and LTV.
Trying to pull all this data from Shopify and your ad platforms manually is a time-consuming nightmare. This is exactly where AI-powered analytics tools like MetricMosaic come in. They automatically connect all your data sources to surface these insights, showing you in plain English which products are truly driving your bottom line.
Pinpoint Your Break-Even Point
Every founder needs to know their break-even point—the exact sales volume you need to hit to cover all your costs and finally start turning a profit. Your contribution margin is the key that unlocks this number.
The formula is refreshingly straightforward:
Break-Even Point (in Dollars) = Total Fixed Costs / Contribution Margin Ratio
Let's say your monthly fixed costs (your Shopify plan, app fees, salaries, etc.) add up to $20,000. If your store's overall contribution margin ratio is 40%, the math looks like this:
- Break-Even Point: $20,000 / 0.40 = $50,000
This means you need to generate $50,000 in sales each month just to keep the lights on. Every single dollar you make beyond that point contributes directly to your net profit. This one number is incredibly powerful for setting realistic sales goals and managing your cash flow, turning a vague hope for profit into a clear, mathematical target.
The Hidden Costs of Manual Profit Tracking
Knowing how to calculate your contribution margin ratio is a huge step forward. But as any Shopify founder can tell you, the real challenge isn't the math—it's getting clean data from fragmented sources in the first place. In the fast-moving world of DTC, trying to track this metric with spreadsheets is a recipe for unreliable reports and missed opportunities.
The old way of doing things is a constant battle. You’re endlessly exporting CSV files from Shopify, trying to stitch them together with ad spend data from Meta and Google, then cross-referencing shipping costs from yet another app. The entire process is painfully slow, tedious, and wide open to human error.
A single copy-paste mistake can throw off your entire analysis. That means you could end up making critical pricing or marketing decisions based on faulty numbers, hurting your ROAS and profitability.
The Problem with Data Scattered Everywhere
For a modern DTC brand, data lives all over the place. Your cost of goods is in one system, your ad spend is split across multiple platforms, and your fulfillment costs are tracked somewhere else entirely. Manually piecing this all together isn't just a time-waster; it’s a massive strategic risk.
By the time you finally wrestle your spreadsheets into submission, the numbers are already stale. You’re always looking in the rearview mirror, analyzing last month’s performance when you need to be making decisions about next week’s campaigns. This data lag means you’re slow to react to shifts in ad costs, shipping rates, or product demand, leaving serious profit on the table.
Manually tracking profitability is like trying to navigate a busy highway by only looking at a paper map you printed last week. You might know the general direction, but you have no idea about the real-time traffic, accidents, or faster routes that have just opened up.
Making the Switch to AI-Powered Analytics
This is exactly where modern, AI-powered analytics tools like MetricMosaic change the game completely. Instead of you chasing down the data, they bring all your data together automatically. By connecting directly to Shopify, your ad platforms, and your shipping software, these systems create a single, reliable source for your brand’s financial health, transforming complexity into clarity.
An AI analytics platform doesn’t just pull numbers; it actually makes sense of them. It automatically calculates your contribution margin ratio in real-time—for every single product and for your entire store. This frees you from the drudgery of data entry and lets you focus on what you do best: growing your brand.
You can instantly see which products are your true profit drivers and which ones are just draining your resources. This clarity allows you to make smarter, faster decisions that have a direct impact on your bottom line.
Manual vs. AI-Powered Profitability Analysis
| Feature | Manual Tracking (Spreadsheets) | AI-Powered Analytics (MetricMosaic) |
|---|---|---|
| Data Collection | Manual exports from multiple platforms (Shopify, Google, Meta, etc.) | Automated, direct integrations pull data in real-time. |
| Update Frequency | Weekly or monthly, depending on manual effort. | Always on, providing up-to-the-minute insights. |
| Accuracy | Prone to human error (copy-paste mistakes, formula errors). | Highly accurate, with validated data connections. |
| Time Investment | Hours or even days of work each month. | Minutes to set up, then runs automatically. |
| Insight Level | Basic, backward-looking reports. | Deep, actionable insights surfaced by AI. |
| Decision Speed | Slow, reactive decisions based on outdated information. | Fast, proactive decisions based on live data. |
Ultimately, the choice is between spending your time in the spreadsheet or spending it acting on the insights. The first is a chore; the second is how you actually grow a profitable business.
How AI Unlocks Predictive Profit Insights
Automating your contribution margin ratio is a huge win, but it’s really just the starting line for growth. For today's DTC brands, the real challenge isn't just knowing what happened last month; it's about predicting what will happen next and understanding exactly which levers to pull to make your growth profitable. This is where AI-driven analytics completely changes the game.
Instead of just reporting the numbers, modern analytics platforms use your contribution margin as the foundation for predictive insights. They help your Shopify brand shift from a reactive to a proactive stance, essentially turning your past performance into a reliable roadmap for the future. This move is fueled by next-gen trends like conversational analytics and story-driven data that ambitious founders can't afford to ignore.
From Static Reports to Dynamic Conversations
Let's be honest, the days of digging through clunky dashboards just to find a simple answer are over. The next generation of tools, like MetricMosaic, brings conversational analytics to the forefront, letting you ask questions about your data in plain English.
Think about it. You could just ask:
- "What was the contribution margin on our holiday bundle?"
- "Which ad campaign had the best contribution margin last week?"
- "Show me the contribution margin ratio for all products under $50."
You get an immediate, accurate answer without having to build a single report. This kind of instant access makes complex metrics available to everyone on your team, empowering them to make smarter decisions in the moment.
Predictive Insights That Drive Action
What if you could see the future impact of your decisions before you made them? That's the power of predictive insights. These tools use AI models to forecast outcomes based on your current data. For instance, an AI co-pilot could simulate what happens if you raise the price of a specific product by 15%, showing you the probable impact on both sales volume and your overall contribution margin.
Suddenly, your contribution margin ratio is no longer just a look in the rearview mirror—it's a strategic tool for navigating the road ahead. You can model different scenarios for sales promotions, shifts in ad spend, or new product launches to figure out which path leads to the most profitable result, all before you commit a single dollar.
Story-Driven Data That Makes Sense
At the end of the day, the best analytics platforms don't just spit out numbers; they tell you a story. Story-driven data frames complex financial metrics in a clear, actionable narrative. Instead of getting a dense spreadsheet, you receive a plain-English summary that points out what actually matters.
"Your 'Sunrise Serum' has a strong 55% contribution margin, but sales have dropped 20% since you paused the latest Meta campaign. Relaunching that ad set could boost your overall profitability by an estimated 8% this month."
This is how AI cuts through the noise. It connects the dots between your marketing efforts, your sales performance, and your bottom-line profitability. It tells you not just what happened but why it happened and what you should do next.
While DTC is its own unique world, seeing how contribution margins work in other sectors really underscores the universal importance of this metric. You can get a broader perspective from this overview of contribution margin usage across different industries. By embracing these AI-powered tools, you can finally turn your store's data from a confusing puzzle into your greatest competitive advantage.
Frequently Asked Questions
Let's tackle some of the most common questions we hear from Shopify founders about contribution margin. Getting these details right can make a huge difference in how you see your business.
What Is a Good Contribution Margin Ratio for a Shopify DTC Brand?
There’s no magic number that works for everyone. What’s considered “good” really depends on your industry and the types of products you sell.
That said, many successful DTC brands find their sweet spot somewhere between 40% and 60%. A higher ratio is a great sign; it means you have more cash left over from each sale to cover your fixed costs (like rent and salaries) and pour back into growing the business.
The best approach is to see how you stack up against your direct competitors, but it's even more important to track your own ratio over time. Your real goal is to see that number steadily improving as your brand grows.
Should Marketing Costs Be Included in the Contribution Margin Calculation?
This is a great question, and the answer is: it depends on the type of marketing cost.
Performance marketing spend—think cost-per-acquisition (CPA) from your Meta or Google ads—is directly tied to generating a sale, so you should absolutely count it as a variable cost. Including it gives you a much clearer picture of your profitability on every single order.
On the other hand, fixed marketing expenses like your marketing team's salaries or a flat monthly agency retainer are best treated as operating expenses. Getting this distinction right is crucial for an accurate contribution margin.
How Often Should I Calculate My Contribution Margin Ratio?
In the fast-paced world of e-commerce, you should be looking at your contribution margin ratio at least monthly.
But when the stakes are high—like for your best-selling products or during a massive campaign like BFCM—checking it weekly is a smart move. It allows you to be more agile and make quick decisions to protect your profits before it's too late.
Of course, doing this by hand is a massive headache. This is where modern, AI-powered analytics tools come in, giving you a real-time, accurate view without all the spreadsheet gymnastics.
Ready to stop guessing and start knowing your true profitability? MetricMosaic connects your Shopify, marketing, and shipping data to give you real-time contribution margin insights, so you can make smarter decisions that actually grow your bottom line. Start your free trial today and see what story-driven analytics can do for your brand.