User Retention Metrics: A Practical Guide for Shopify Founders
Unlock growth with clear user retention metrics, actionable formulas, and AI-powered tips to boost LTV for Shopify brands.
So, what exactly are user retention metrics? Think of them as the vital signs for your Shopify store. They measure your ability to keep customers coming back—how many first-time buyers return, how often they shop, and how much they spend over their entire journey with your brand.
Ultimately, these metrics show you the true health and long-term profitability of your DTC business.
Why Your Shopify Store Is Leaking Money
Ever feel like you’re pouring water into a leaky bucket? You're spending a fortune on Meta and Google Ads, your Shopify dashboard is lighting up with new sales, but at the end of the month, profitability just feels out of reach.
This is a familiar headache for so many DTC founders. Sky-high customer acquisition costs (CAC) can easily mask a deeper, quieter problem: poor customer retention.
The hard truth is that you can't build a sustainable business by constantly chasing new customers. Real, lasting growth comes from creating a loyal base that comes back again and again. The real money is made on the second, third, and fourth sale—not just the first.

The Pain of Fragmented Data
For most Shopify founders, the real struggle is just getting a straight answer from your data. You’re left trying to piece together a messy puzzle scattered across a bunch of different platforms:
- Shopify: It shows you the sales numbers, but not the full story behind the customer who made the purchase.
- Google Analytics 4: It tracks what people do on your site, but it's a pain to cleanly connect that behavior back to repeat purchases.
- Klaviyo: It tells you who opened an email, but that’s completely disconnected from your acquisition channels and overall profitability.
Trying to stitch all this together in spreadsheets is a complete nightmare. It’s slow, full of errors, and almost never gives you the kind of clear insights you need to make smart decisions. You end up guessing which marketing channels are actually bringing in valuable, long-term customers and which ones are just burning through your ad budget.
Focusing on a few key user retention metrics can finally bring clarity to this chaos. It’s about shifting from chasing vanity metrics like traffic and top-line revenue to understanding the numbers that actually drive your bottom line.
This is where AI-powered analytics platforms are changing the game. Instead of you spending hours trying to be an analyst, next-gen tools like MetricMosaic automatically pull all your data from Shopify, GA4, and Klaviyo into one place. They cut through the complexity and deliver clear, actionable insights, surfacing the story your data is trying to tell you—no data team required.
They turn your raw store data into a powerful competitive advantage, showing you exactly where the leaks are and how to plug them for profitable growth.
The Essential Metrics Every Founder Must Know
If you're only looking at daily sales, you're missing the bigger picture. To get a real grip on your store's health, you have to look past those vanity metrics and dig into the numbers that signal long-term, sustainable growth. These are the core user retention metrics—the true vital signs for your DTC brand.
Think of it like this: just tracking revenue is like driving a car while only looking at the speedometer. Sure, you know how fast you’re going right now, but you have no clue if you're about to run out of gas. Let’s pop the hood and look at the gauges that really matter.
To make this easier, here's a quick cheat sheet for the metrics we're about to cover.
Core Retention Metrics At a Glance
| Metric | What It Measures | Simple Formula | The Question It Answers |
|---|---|---|---|
| Customer Retention Rate (CRR) | The percentage of customers who stick with you over a specific period. | (Ending Customers - New Customers) / Starting Customers | "Are our customers loyal?" |
| Repeat Purchase Rate (RPR) | The percentage of customers who have made more than one purchase. | (Customers with >1 Purchase) / Total Customers | "Did they like it enough to buy again?" |
| Customer Lifetime Value (CLTV/LTV) | The total predicted revenue a single customer will generate for your brand. | Average Order Value x Purchase Frequency x Customer Lifespan | "How much is a customer worth over time?" |
This table gives you the basics, but the real power comes from understanding the story each metric tells. Let's break them down.
Customer Retention Rate (CRR)
Your Customer Retention Rate is the most straightforward measure of loyalty you have. It’s simple: it tells you what percentage of customers from one period (say, last quarter) decided to stick around and are still with you in this period. It's the ultimate grade on your report card for customer experience and product-market fit.
A high CRR is the hallmark of a healthy, growing brand. It’s proof that people love what you sell, they trust you, and they see a real reason to come back. For any Shopify store, this is the metric that shows you’re building a lasting brand, not just a one-hit-wonder.
Repeat Purchase Rate (RPR)
While CRR tells you who stays, your Repeat Purchase Rate (RPR) zooms in on how many of your customers actually come back to buy again. This metric is a dead-simple, powerful signal of your product's "stickiness." It cuts through the noise to answer one critical question: "Did they like it enough to buy again?"
For DTC brands, a strong Repeat Purchase Rate is the engine of profitability. Every repeat sale comes without the high customer acquisition cost of the first, which directly pads your margins and improves your overall financial health.
This is especially critical if you sell consumables or anything with a natural repurchase cycle. A rising RPR is a clear sign that your product, marketing, and post-purchase experience are all hitting the mark and turning one-time buyers into loyal fans.
Customer Lifetime Value (LTV)
Customer Lifetime Value is the North Star metric for building a business that lasts. It’s a forecast of the total revenue you can realistically expect from a single customer over their entire relationship with your brand. LTV is what connects retention directly to your bottom line, turning a fuzzy concept like "loyalty" into a hard financial number.
Knowing your LTV is a complete game-changer for your marketing. It tells you exactly how much you can afford to spend to acquire a new customer (your Customer Acquisition Cost, or CAC) while staying profitable. When you improve retention and increase LTV, you give yourself more breathing room to invest in growth, outbid your competitors, and scale your business the right way.
To really get a handle on how your business is performing and start making smarter decisions, it's worth diving into a comprehensive guide to customer retention metrics that actually matter. Understanding these numbers is the absolute first step toward building a data-informed growth strategy.
These three metrics—CRR, RPR, and LTV—are the foundation of any solid retention strategy. But trying to calculate them manually across Shopify, your ad platforms, and your email provider is a massive headache. This is exactly where an AI-powered analytics platform like MetricMosaic comes in. It automatically pulls all your data together to calculate these KPIs, saving you from spreadsheet hell and giving you the clarity you need to make faster, better decisions.
Unlocking Growth With Cohort Analysis
The big-picture metrics we've covered—CRR, RPR, and LTV—are great for a quick health check on your Shopify store. They tell you if things are moving in the right direction. But if you stop there, you're only seeing the surface. It's like judging a car's performance just by its top speed, without ever popping the hood to see how the engine is really doing.
To find the real levers for growth, you have to go deeper than store-wide averages. This is where a powerful technique called cohort analysis comes into play.
Think of a cohort as a graduating class for your customers. It's simply a group of people who all took the same action in the same timeframe. For a DTC brand, the most common way to do this is to group customers by the month they made their first purchase. So, everyone who first bought from you in January becomes the "January Cohort," February's new buyers are the "February Cohort," and so on.
By tracking these groups separately over time, you start to see the real story of your customer behavior—a story that gets completely lost in those high-level averages.
Reading the Retention Curve
When you plot how a cohort behaves over several months, you create what's called a retention curve. The shape of this curve is one of the most honest pieces of feedback you'll ever get about your brand.
Here's how to read it:
- A Steep Drop-Off: If your curve plummets after the first month and keeps diving towards zero, that's a red flag. It tells you customers aren't sticking around. This could point to anything from product quality issues to unmet expectations or a clunky post-purchase experience.
- A Healthy, Flattening Curve: A strong curve will always have an initial drop—that's normal. But then, it will start to flatten out. That "smile" in the curve is exactly what you want to see. It means you've found a core group of loyal customers who are consistently coming back, forming the profitable foundation of your business.
This chart provides a simplified view of the essential user retention metrics that form the basis of cohort analysis.
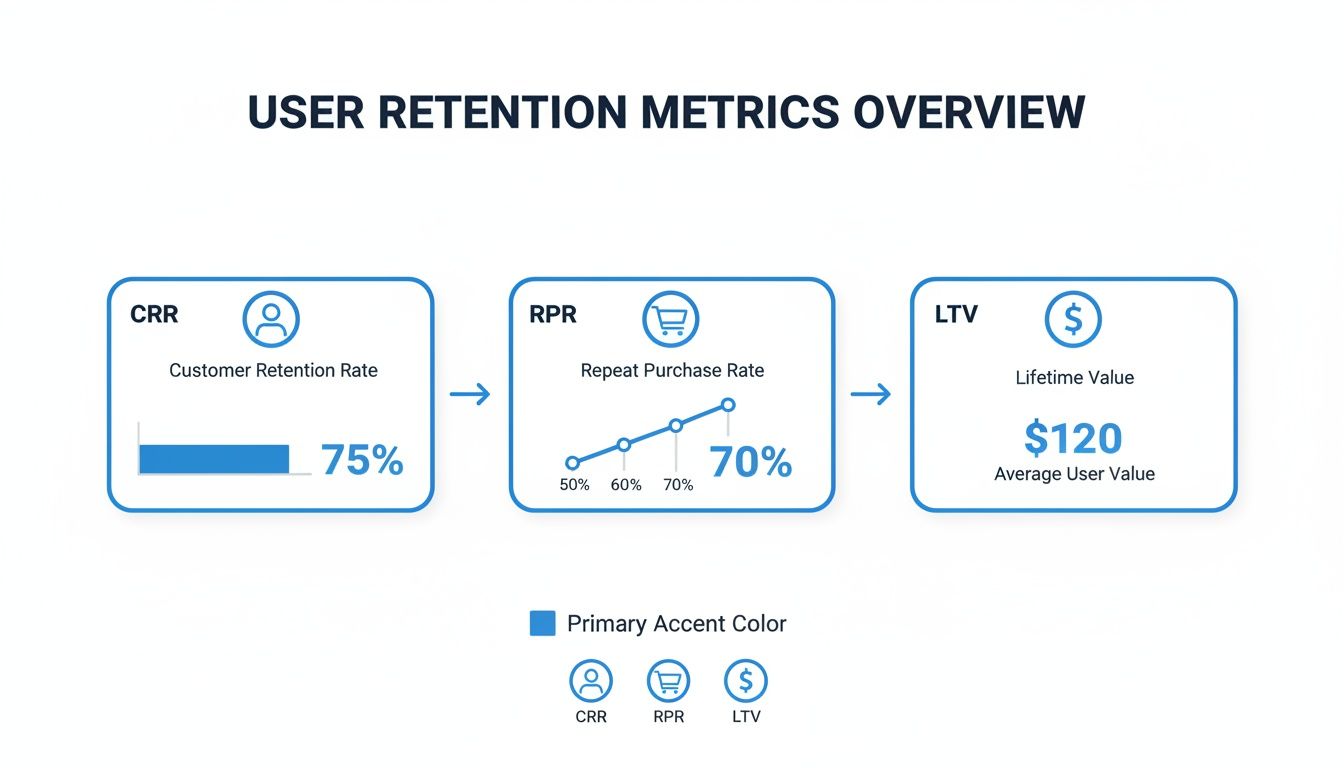
Analyzing CRR, RPR, and LTV at the cohort level, instead of just store-wide, is how you find out which specific customer groups are actually driving your long-term value.
Cohorts for Your Shopify Store
The real magic happens when you slice your cohorts by more than just their sign-up date. This is how you connect your marketing spend directly to long-term profitability.
Start asking questions by creating cohorts based on:
- Acquisition Channel: Are the customers you acquire from Meta ads more loyal than the ones from TikTok or Google?
- First Product Purchased: Do people who buy your hero product end up having a higher LTV than those who start with a lower-priced item?
- Discount Code Used: Did the cohort that used the "WELCOME20" coupon churn faster than customers who paid full price?
This is where trying to do things manually in a spreadsheet becomes a soul-crushing, error-prone nightmare. An analytics tool built for this, like MetricMosaic, automates the entire process. It visualizes your cohort performance instantly and surfaces the critical stories hidden in your Shopify data, so you can spend your time acting on insights, not crunching numbers.
Cohort analysis tells you not just if you're retaining customers, but which customers you're retaining and why. It's the key to understanding what's truly working in your business.
It also helps you set realistic goals. For most ecommerce brands, the biggest drop-off happens right at the beginning. Data shows shopping apps often retain only about 10-17% of users by Day 7, which drops to a mere 4-9% by Day 30. This just proves how critical those first few touchpoints are. A small improvement to your welcome flow in Klaviyo to nudge Day 7 retention can have a massive downstream effect on LTV and shorten your CAC payback period. To see how you stack up, you can find more on these ecommerce retention patterns online.
How AI Is Changing the Retention Game for Shopify Brands
For years, trying to understand customer retention on Shopify felt like a manual, reactive chore. You’d spend hours buried in CSV exports, wrangling pivot tables in Google Sheets, and trying to piece together a story from fragmented data—usually long after your best customers had already churned. The insights were always looking in the rearview mirror.
That whole dynamic is changing. AI-powered analytics platforms are flipping the script, turning retention analysis from a slow, manual task into a proactive, automated growth engine. It’s no longer about just reporting on what happened last quarter; it’s about predicting what will happen next and telling you exactly what to do about it.
This shift moves your brand from defense to offense, letting you get ahead of churn before it even happens.
Moving From Reporting to Predicting
The biggest leap forward is the move from basic reporting to predictive modeling. Instead of just calculating your historical Customer Lifetime Value (LTV), AI can build predictive LTV models that forecast the future revenue you can expect from brand-new customer cohorts.
Imagine launching a new collection and knowing, within days, which acquisition channels are bringing in customers with the highest predicted LTV. That’s the power of AI. It gives you the confidence to double down on your most profitable campaigns in real-time, not months later when the opportunity is gone.
Similarly, churn prediction models are a game-changer for DTC brands. AI analyzes thousands of data points—purchase frequency, time since last purchase, product category, and even email engagement—to identify at-risk customers with uncanny accuracy. It’s like an early warning system that flags customers who are quietly drifting away, giving you a crucial window to win them back with a targeted offer or personalized message.
Introducing Story-Driven Data
Let's be honest: traditional dashboards are dead. They throw charts and numbers at you, but they leave the hardest part—the interpretation—up to you. You’re still left staring at a retention curve, trying to figure out the "why" behind the data. This is where next-gen tools like MetricMosaic introduce the concept of story-driven data.
Instead of just presenting a chart, an AI-powered platform can automatically surface a critical insight in plain English.
"Your Meta Ads cohort from Black Friday has a 25% higher LTV than your Google Ads cohort from the same period. Consider reallocating budget to scale the winning Meta campaign."
This is no longer just data; it's a story with a clear hero (your Meta campaign) and a clear next step (shift your budget). The AI does the heavy lifting of connecting the dots between your ad spend, your Shopify sales, and your customer behavior to deliver an actionable recommendation.
This approach is especially powerful for busy founders and marketers who don’t have time to be full-time data analysts. It closes the gap between insight and action, turning your store's data into a genuine competitive advantage. AI handles the complexity so you can focus on what you do best: growing your brand. By turning complex datasets into clear narratives and predictive insights, these tools finally make data-driven growth accessible to every Shopify store.
Actionable Strategies to Improve Retention Today
Understanding your retention metrics is one thing. Actually doing something with that knowledge is where the real growth happens. It’s the difference between staring at your cohort curves and actively bending them in the right direction.
For a Shopify founder, this means putting that data to work everywhere—from the first "welcome" email to a customer's tenth purchase. Let's get past the theory and into concrete, data-informed plays you can run right now to keep your customers coming back for more.
Personalize Your Welcome Series with Cohort Data
Your Klaviyo welcome series is one of the most powerful retention tools you have. It's your first, best chance to make a real impression and set the tone for the entire relationship. But a generic, one-size-fits-all flow just doesn't cut it anymore.
Instead, use cohort data to segment new customers right from the jump. Did a new buyer come from a specific Meta ad campaign that you know produces high-LTV customers? Tag them. Send them a welcome series that tells your brand story and showcases your bestsellers.
Did they buy a niche, specific product? Tailor their first few emails with content and cross-sells that make sense for that category. By connecting acquisition data to your lifecycle marketing, you can actually measure if these personalized flows are improving 30-day repeat purchase rates for those specific cohorts. That's how you close the loop between insight and action.
Identify and Amplify Your Magic Moment
Every great DTC brand has a "magic moment." It's that key action or experience within the first 30 days that flips a switch, turning a casual buyer into a loyal fan. It could be the first time they use your product and see results, or maybe it's an unexpectedly great post-purchase follow-up.
The clues to finding your magic moment are buried in your retention data. Take a look at your most loyal, highest-value cohorts. What did they do differently in their first month? Did they watch a certain tutorial video? Join your community? Buy a specific combination of products?
Once you've identified a pattern, your job is to re-engineer your entire post-purchase experience to guide every new customer toward that same magic moment. Build email and SMS flows in Klaviyo that encourage that behavior, then watch your 90-day retention curve to see the impact and keep refining.
The goal is to make your ideal customer journey the default journey for everyone. By identifying what your best customers do naturally, you create a repeatable playbook for cultivating loyalty at scale.
Leverage Smart Loyalty and Personalization Programs
Building loyalty isn't just about handing out discounts; it’s about making customers feel seen and valued. This is where a strategic loyalty program and deep personalization can have a massive impact. It’s no surprise the global loyalty management market is projected to grow from $15.2 billion in 2025 to over $41.2 billion by 2032.
Why the surge? Because it flat-out works. We all know personalized emails perform better than generic blasts, both in opens and in revenue. When a Shopify brand with 100,000 annual customers uses a tiered loyalty program and personalization to bump its repeat purchase rate from 30% to 38%, the results are huge.
At a $75 AOV and a 30% gross margin, that 8-point lift can add an extra $180,000 in gross profit annually. These are the kinds of numbers that justify investing in modern tools that can spot which customers to reward and re-engage.
Even a simple tiered rewards program can give your repeat purchase rate and LTV a serious boost. For a deeper dive, check out these 8 strategies for ecommerce customer retention. The key is to connect your loyalty program data back to your core retention metrics so you can prove its financial impact.
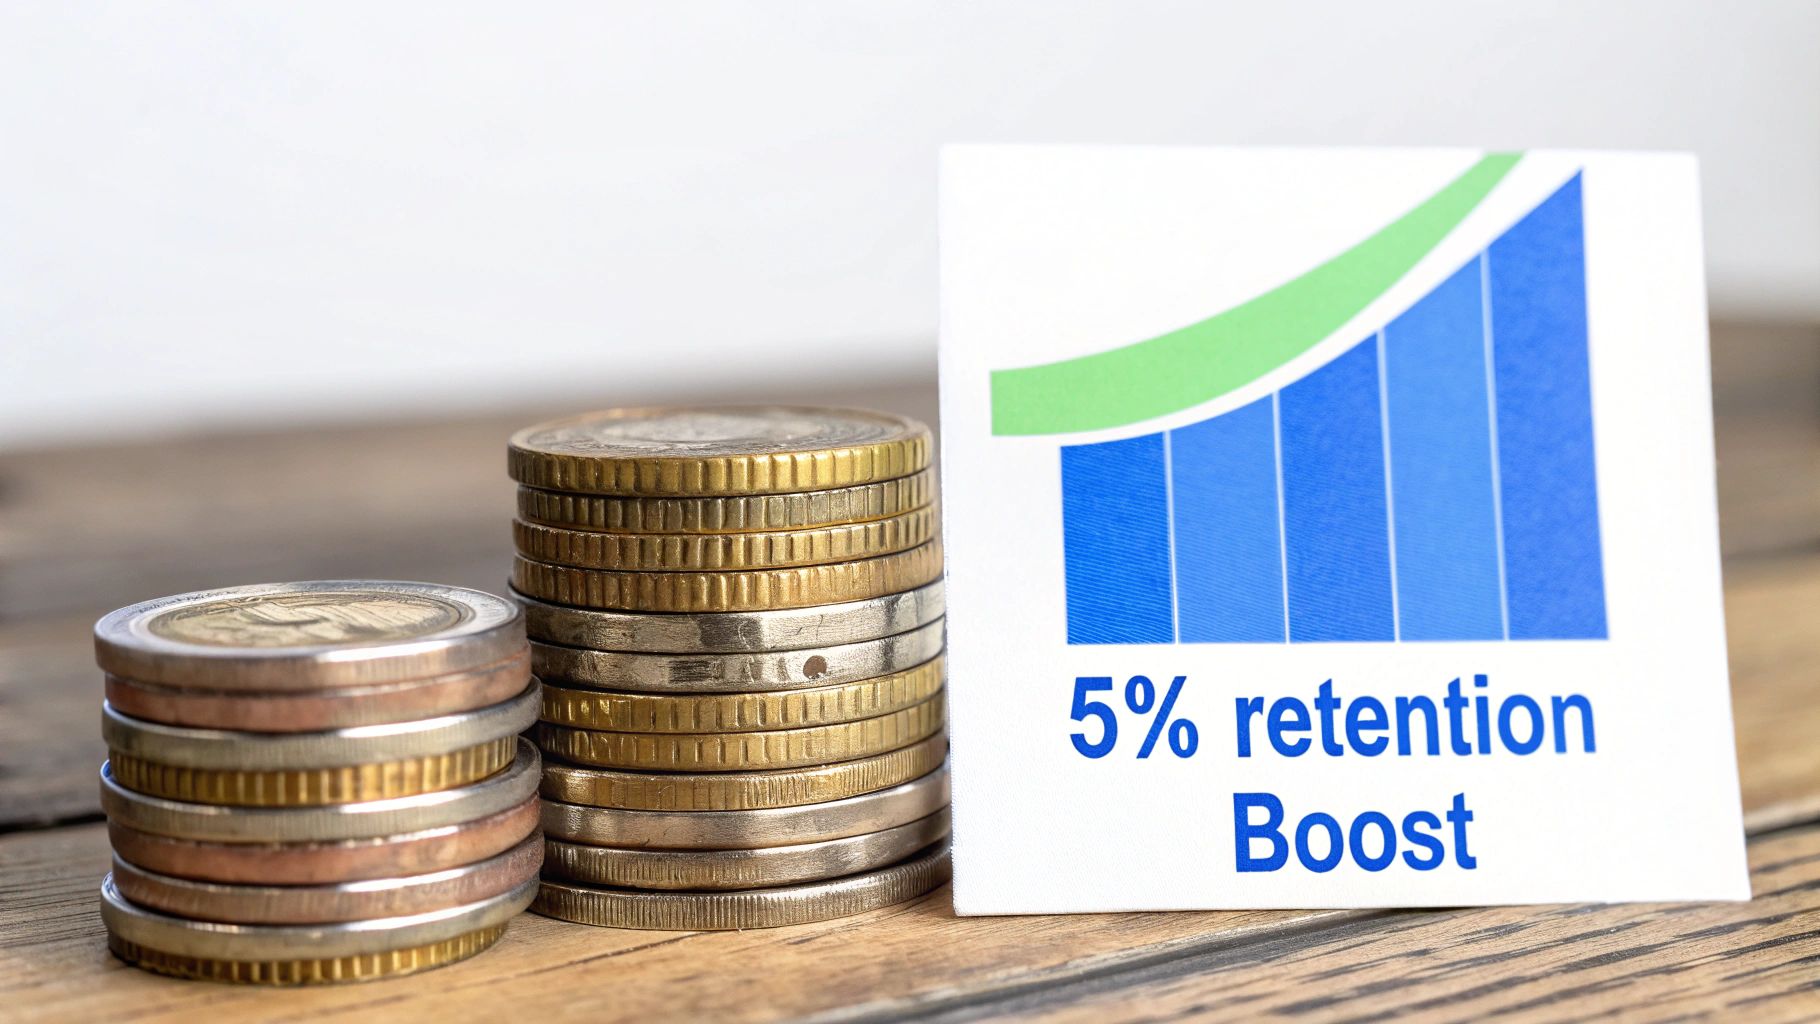
The Financial Impact of a 5% Retention Boost
So far, we've been looking at retention metrics like they're vital signs for your brand's health. They tell you what's going on under the hood. But let's be real—what really matters to every founder is the direct impact on the bottom line. Cohort curves are great, but seeing how a tiny improvement turns into actual cash is what changes the game.
Let’s make this concrete.
Imagine your Shopify store pulls in an average order value (AOV) of $60. Your current one-year customer retention rate is sitting at a respectable 30%, giving you a Customer Lifetime Value (LTV) of around $180. Now, what happens if you take what you’ve learned from the data and nudge that retention rate up by just five points, from 30% to 35%?
It doesn't sound like much, but the ripple effect is massive.
Connecting Retention to Your Ad Spend
That small 5-point lift can jack up your realized LTV by 8–12%, depending on your specific margins and how often people buy. All of a sudden, your average $180 LTV is looking a lot more like $200. This one small bump completely rewrites the economics of your growth. If you're curious how you stack up, Shopify has some fascinating benchmarks on customer retention rates by industry.
Here's where it gets interesting. A higher LTV gives you a higher allowable Customer Acquisition Cost (CAC). If you were previously capping your CAC at $60 to keep a healthy 3:1 LTV:CAC ratio, you now have the green light to spend up to $66 per new customer while keeping the exact same profitability.
That extra budget is your new secret weapon.
It means you can:
- Outbid your competition on prime ad placements on Meta and Google.
- Pour more fuel on your winning campaigns without torching your ROAS.
- Finally test out new channels that always seemed just a little too expensive.
This is the critical link so many DTC brands miss. Improving retention isn't just about warm-and-fuzzy loyalty; it's about funding more aggressive, more profitable customer acquisition. It creates a powerful, self-sustaining growth loop.
Of course, this whole playbook falls apart if you're working with fragmented data. Trying to piece together the truth from separate reports in Shopify, GA4, and Klaviyo is a recipe for bad decisions. To confidently pull these levers, you need a platform that connects the dots for you—from the first ad click to the tenth repeat purchase. An AI-powered tool like MetricMosaic does just that. It's time to stop guessing and start building a more profitable, scalable business on a foundation of solid data.
A Few Lingering Questions About Retention Metrics
Even after you get the hang of the core metrics, some practical questions always pop up. Let's tackle a few of the most common ones we hear from founders running Shopify brands.
What’s a Good Customer Retention Rate, Really?
This is the million-dollar question, and the honest-to-goodness answer is: it depends.
You’ll see ecommerce benchmarks thrown around—maybe somewhere in the 25% to 35% range—but those are just averages across a huge mix of businesses. A company selling mattresses is going to have a wildly different "good" retention rate than a DTC brand selling monthly coffee subscriptions.
The only benchmark that truly matters is your own. The goal isn't to chase some generic industry number. It's to see your own retention rate consistently ticking upwards, month after month. Your own trend line is infinitely more valuable than a comparison to an irrelevant average.
How Often Should I Actually Check My Retention Metrics?
Don't feel like you need to live inside your analytics dashboard 24/7. It's all about finding a rhythm that works for you. Not every metric needs daily monitoring.
For most busy Shopify operators, a practical cadence looks something like this:
- Weekly Check-in: Glance at your leading indicators. Think repeat purchase rates for recent cohorts or early engagement scores. These give you a quick pulse on whether customer behavior is heading in the right direction.
- Monthly Deep Dive: This is where you dig into the lagging indicators like your overall Customer Retention Rate (CRR) and LTV. It's the perfect time to really analyze cohort performance and see if the strategies you launched last month actually moved the needle.
Can I Just Track This Stuff in a Spreadsheet?
Technically, yes. You could try to wrangle all your data from Shopify, GA4, and Klaviyo into one massive spreadsheet. But the real question isn't can you, it's should you? The manual effort is a huge time-sink, the chance of a copy-paste error is sky-high, and you get absolutely zero predictive insight.
Manually tracking retention in spreadsheets is like trying to navigate a new city with a folded paper map. You might get where you’re going eventually, but you’re guaranteed to waste a ton of time, make a few wrong turns, and have no idea what the traffic looks like five blocks ahead.
An AI-powered analytics platform does all that manual, soul-crushing data work for you. It doesn't just calculate your core user retention metrics in seconds; it gives you the forward-looking insights—like which customers are about to churn or what a new cohort's future LTV might be—that a spreadsheet simply can't.
Stop guessing and start growing. MetricMosaic unifies your Shopify data, turning complexity into clear, actionable stories that boost your retention and profitability. Start your free trial today.