Your Actionable Guide to Shopify Sales Growth Calculation
Stop guessing your Shopify store's trajectory. Learn the essential sales growth calculation methods to make smarter marketing and inventory decisions.
As a DTC founder, you're practically swimming in data. Your Shopify dashboard, GA4, Meta Ads, Klaviyo... each tells a piece of your brand's story. It's easy to get a dopamine hit from a good sales day, but that's just one pixel in a much larger picture. Relying on those fragmented, surface-level numbers is like trying to navigate a ship by only looking at the waves hitting the bow. You see the immediate motion, but you have no clue if you're actually on course.
This is where a deliberate sales growth calculation becomes your strategic compass. It pulls you out of reactive, day-to-day firefighting and into proactive, long-term strategy. It's the difference between guessing and knowing.
Why You Need to Look Beyond Your Shopify Dashboard
Knowing your true growth rate helps answer the make-or-break questions you face every day:
- Marketing Spend: Should you double down on that Meta campaign or pull the plug? Consistent month-over-month growth from a specific channel gives you the confidence to scale.
- Inventory Forecasting: Are you ready for the next quarter? Understanding seasonal growth patterns is the difference between stocking out during a peak and tying up cash in products that aren't moving.
- Strategic Expansion: Is now the right time to launch that new product line? A strong, stable year-over-year growth rate signals you have a solid foundation to build on.
From Manual Spreadsheets to Automated Insight
The real challenge for most Shopify brands isn’t a lack of data; it's the soul-crushing manual work of stitching it all together. Exporting CSVs, wrestling with spreadsheets, and trying to make numbers from different platforms line up is a recipe for headaches and costly errors. One misplaced formula could trick you into scaling a failing ad campaign.
This is exactly why modern DTC brands are shifting to AI-powered analytics. Instead of just dumping raw numbers on you, these tools automatically unify your data to tell a clear, reliable story about your business's health. The tedious task of calculating sales growth becomes an automated, insightful process. You no longer need a dedicated analyst to find the signal in the noise; the insights are surfaced for you.
And as you dial in your growth metrics, you can pull other levers to accelerate your progress. Tactics like effective Shopify Conversion Rate Optimization for Scaling Brands can directly improve the numbers you're tracking.
The goal is to make your data work for you, not the other way around. Accurate growth calculation gives you the clarity to put your resources—time, money, and energy—where they’ll make the biggest impact.
Just look at the broader ecommerce landscape. Global ecommerce sales hit around $6.33 trillion. A year later, that number jumped to $6.86 trillion—that’s an 8.37% year-over-year growth, according to the latest global ecommerce sales data from Shopify. This isn't just an abstract statistic; it's the result of the same sales growth calculations every DTC brand needs to master to win their piece of the market.
Before we dive into the "how-to," let's get a quick overview of the key formulas you'll be using. This table serves as a handy reference guide for everything we're about to cover.
Essential Sales Growth Formulas at a Glance
A quick-reference table defining the key sales growth formulas we'll cover, giving you an immediate overview of the tools you'll learn to use.
| Growth Formula | What It Measures | Best Used For |
|---|---|---|
| Year-over-Year (YoY) | Growth compared to the same period last year. | Identifying long-term trends and smoothing out seasonality. |
| Month-over-Month (MoM) | Growth compared to the previous month. | Tracking short-term momentum and campaign impact. |
| Period-over-Period (PoP) | Growth between any two custom periods. | A/B testing, analyzing specific sales events like BFCM. |
| CAGR | Average annual growth rate over multiple years. | Gauging long-term, compounded business performance. |
With these formulas in your toolkit, you'll be able to move from simply tracking revenue to truly understanding the story behind your growth. Let's get into the specifics of how to calculate each one.
Mastering the Four Core Growth Formulas
Alright, you know why you need to track sales growth. Now let's get into the how.
For a busy founder, manually crunching these numbers can feel like one more thing on a never-ending list. But getting comfortable with these formulas is how you start turning raw data into a real story about your brand's momentum.
The good news? You don't need a finance degree. These four core formulas are surprisingly simple, and modern AI-powered analytics tools can do all the heavy lifting, freeing you up to focus on the bigger picture. This flow—gathering data, running the calculation, and finding the story—is the heart of making smart, data-backed decisions.
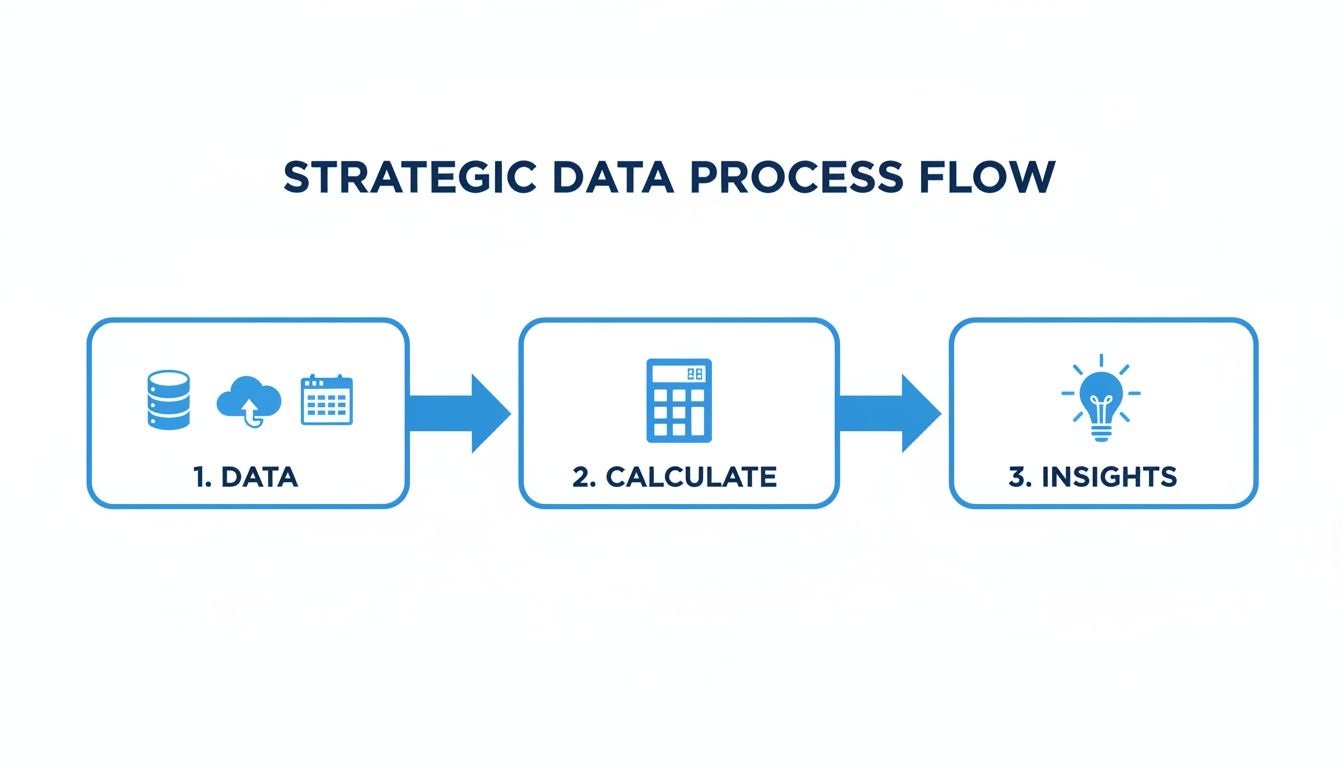
This is the whole game right here. Pull data from all your sources, apply the right formula, and use your tools to surface what actually matters. That's how you get a real strategic edge.
Let's walk through each formula with a practical example from a fictional Shopify skincare brand I'll call "Glow Labs."
Month-over-Month (MoM) Growth for Short-Term Wins
Month-over-Month (MoM) growth is your tactical pulse-check. It’s perfect for seeing the immediate impact of your marketing campaigns and operational tweaks. Did that influencer collab in April actually work? Did your new welcome series in May move the needle? MoM gives you a quick, clean answer.
The formula is straightforward:
MoM Growth (%) = [(Current Month's Sales - Previous Month's Sales) / Previous Month's Sales] x 100
Let's say Glow Labs ran a big TikTok campaign in May and wants to see if it paid off.
- April Sales: $50,000
- May Sales: $65,000
Plugging those numbers in:
[($65,000 - $50,000) / $50,000] x 100 = 30% MoM Growth
A 30% jump is a huge signal that the campaign crushed it. This insight is gold. It tells you where to double down on your ad spend and what kind of content is actually connecting. This is where AI-powered analytics can shine, too—by automatically attributing that spike to the specific TikTok campaign, saving you hours of detective work.
Quarter-over-Quarter (QoQ) Growth for Seasonal Trends
Quarter-over-Quarter (QoQ) growth zooms the lens out a bit, looking at performance over a three-month stretch. This is great for smoothing out the bumps from a single good or bad week and helps you start to see broader seasonal patterns in your business.
The formula works the same way:
QoQ Growth (%) = [(Current Quarter's Sales - Previous Quarter's Sales) / Previous Quarter's Sales] x 100
Let's look at Glow Labs' performance from Q1 to Q2.
- Q1 Sales (Jan-Mar): $150,000
- Q2 Sales (Apr-Jun): $195,000
The calculation is pretty simple:
[($195,000 - $150,000) / $150,000] x 100 = 30% QoQ Growth
This confirms the strong momentum we saw in the MoM calculation. It’s a powerful number for internal planning and for showing investors that you’re on a consistent upward trend.
Year-over-Year (YoY) Growth for Long-Term Health
Year-over-Year (YoY) growth is, in my opinion, the single most important metric for understanding the real health of your Shopify brand. It compares your performance in a specific period (a month, a quarter) against the exact same period last year.
Why is this so critical? Because it automatically strips out seasonality.
Comparing your December sales to November’s will almost always look great because of the holidays, but it’s a vanity metric. Comparing this December to last December tells you if you've actually grown the business.
The formula should look familiar by now:
YoY Growth (%) = [(Current Period's Sales - Previous Year's Same Period's Sales) / Previous Year's Same Period's Sales] x 100
Let's check in on Glow Labs’ Q2 performance, year-over-year.
- Q2 2024 Sales: $195,000
- Q2 2023 Sales: $120,000
And the YoY calculation:
[($195,000 - $120,000) / $120,000] x 100 = 62.5% YoY Growth
A 62.5% YoY growth rate is a powerful story. It tells investors, partners, and your team that the business isn't just having a good quarter; it's on a sustainable, long-term growth path. This is the number that builds confidence and proves your strategies are delivering lasting results.
Compound Annual Growth Rate (CAGR) for the Investor Pitch
Last but not least, there’s the Compound Annual Growth Rate (CAGR). This isn't for tracking campaigns. This is for painting the big picture of your growth over several years. It’s the metric that matters most when you're talking to investors or planning an exit, because it shows your average annual growth rate while smoothing out the highs and lows of individual years.
The formula is a bit more involved, but the idea is simple:
CAGR = [(Ending Value / Beginning Value)^(1 / Number of Years)] - 1
Let's imagine Glow Labs has been operating for three years.
- End of Year 1 Sales: $200,000
- End of Year 3 Sales: $700,000
- Number of Years: 2 (the time that passed from the end of Year 1 to the end of Year 3)
Let's run the numbers:
[($700,000 / $200,000)^(1/2)] - 1 = 87% CAGR
An 87% CAGR demonstrates incredible, consistent expansion. It shows that Glow Labs isn’t just growing—it's accelerating. Of course, to make these formulas work for you, you also need proven strategies to grow retail sales to ensure the numbers you're plugging in keep trending upward.
Looking Beyond Gross Revenue for True Growth
The core formulas are a great starting point, but just tracking gross revenue is a classic rookie mistake. It can paint a dangerously misleading picture of your Shopify brand's health.
To really understand your growth, you have to look deeper at the nuances that standard formulas miss—the kind of details that separate fast-growing brands from the ones that stagnate.
Think of it this way: gross revenue is the top-line number your payment processor reports. It’s exciting, sure, but it ignores the realities of running a DTC business, like returns, discounts, and shipping costs. To get a real measure of your performance, you need to focus on a much more honest metric.
The Critical Shift to Net Sales Growth
Your Net Sales Growth is the true indicator of your financial momentum. It’s what you're left with after subtracting all the necessary deductions that are part of every ecommerce operation. This isn't just an accounting detail; it's a strategic necessity.
The formula is simple but powerful:
Net Sales = Gross Sales - Returns & Refunds - Discounts
Why does this matter so much? Imagine you ran a massive sale that doubled your gross revenue month-over-month. On the surface, that looks like a huge win. But if half those orders were returned and you gave a 40% discount on the rest, your net sales might actually be lower than the previous month.
This is how brands go broke while looking successful.
Calculating growth based on net sales gives you an honest assessment. It reveals whether your growth is profitable and sustainable, not just a temporary spike driven by margin-crushing promotions.
Shifting your focus from gross to net sales is the first step toward building a data-driven culture. It forces you to confront the real costs of doing business and optimize for profitability, not just vanity metrics.
Taming Seasonality in Your Analysis
Another common trap for Shopify founders is misinterpreting seasonality. Comparing your Black Friday Cyber Monday (BFCM) sales in November to your performance in October is pointless. Of course November looks better! That comparison tells you nothing about whether your brand is actually growing.
To handle seasonality correctly, you have to compare apples to apples. This is where Year-over-Year (YoY) analysis becomes your best friend.
- Compare BFCM 2024 to BFCM 2023. Did you grow your holiday sales?
- Analyze summer sales this July versus last July. Is your warm-weather collection performing better?
- Track your post-holiday slump in January versus the prior January. Are you getting better at retaining those holiday shoppers?
By using YoY comparisons, you effectively neutralize the predictable ups and downs of the retail calendar. This lets you see the underlying growth trend of your business, separate from the seasonal noise.
The Messy Reality of Channel Attribution
So, your net sales are up 25% YoY. That’s great news, but the next question is always the same: where did that growth come from? This is the thorny challenge of channel attribution.
Was it your new Meta ad campaign? The influencer you partnered with? Your Klaviyo email flows? Or organic search?
In a typical Shopify setup, the data is fragmented across platforms.
- Shopify tells you the sale happened.
- Google Analytics might attribute it to organic search.
- Meta Ads will claim credit if the user saw an ad recently.
Trying to manually stitch these sources together in a spreadsheet is a nightmare. It’s slow, riddled with errors, and often leads to more confusion than clarity. You could easily end up scaling the wrong channel while cutting the budget from what’s actually working.
This is precisely where modern analytics platforms change the game. An AI-powered tool like MetricMosaic automatically unifies data from all your sources—Shopify, GA4, Meta, Klaviyo—into a single source of truth. It uses sophisticated models to give you a clear, reliable picture of which channels are driving real net sales growth.
Instead of wrestling with VLOOKUPs, you get an instant, trustworthy growth percentage, broken down by the channels that matter. This transforms your sales growth calculation from a complex data puzzle into a clear, actionable insight.
Common Pitfalls That Distort Your Growth Data
You’ve got the formulas down and you’re tracking net sales—that’s a huge first step. But even with the best intentions, it's surprisingly easy to fall into a few common traps that can completely warp your perception of growth. An accurate sales growth calculation isn't just about plugging numbers into an equation; it’s about understanding the context behind them.
Think of this as a quick debrief from someone who's been there. I’ve seen these simple mistakes cause even the sharpest founders to make bad calls on inventory, marketing spend, and overall strategy. Dodging them is key to actually trusting your numbers and making decisions with confidence.
Comparing Inconsistent Time Periods
One of the most frequent—and sneaky—errors is comparing months with a different number of days. It sounds almost trivial, but it can paint a completely false picture of your performance.
For instance, comparing your sales from a 31-day January to a 28-day February will almost always show a dip. Was it a real performance drop, or did it just happen because you had three fewer days to sell? Without normalizing the data, you can't be sure. This can lead to unnecessary panic or, even worse, trying to "fix" a problem that doesn't actually exist.
To get around this, you can calculate an average daily sales figure for each month. This gives you a true apples-to-apples comparison of your sales velocity, independent of the calendar's quirks.
An even better approach is to lean on Year-over-Year (YoY) comparisons, especially for monthly and quarterly data. This naturally accounts for both day-count differences and seasonality, giving you the cleanest possible look at your actual growth trajectory.
Modern AI-powered analytics tools can automate this for you, so you're always comparing equivalent periods without even having to think about it.
Confusing Revenue Growth with Profit Growth
This is a big one. It's a mistake that can sink a Shopify brand faster than almost anything else.
Celebrating a 20% month-over-month revenue spike feels great, but what if you got there by running a 40% site-wide discount and tripling your ad spend? Sure, your top-line revenue grew, but your profitability almost certainly took a nosedive.
As the old saying goes: revenue is vanity, profit is sanity.
True, sustainable growth isn't just about selling more; it's about selling more, profitably. You have to constantly look at your sales growth alongside your margins and key metrics like ROAS and CAC.
This means connecting the dots between:
- Net Sales: Revenue after discounts and returns.
- Cost of Goods Sold (COGS): What you paid for the products you sold.
- Customer Acquisition Cost (CAC): How much you spent to land that customer.
When you track these together, you might discover that your most "successful" sales campaigns are actually losing you money. This is where AI-powered analytics platforms like MetricMosaic become so valuable. They automatically connect your Shopify sales data with your ad spend from platforms like Meta, giving you a crystal-clear view of your profit on every single order and campaign.
Failing to Segment Your Growth Data
A single, store-wide growth number is a decent starting point, but the real magic happens when you break it down. An overall growth rate of 15% could be hiding a much more interesting story just beneath the surface.
What if your sales from organic search actually grew by 50%, while your paid social channels declined by 10%?
Without segmenting, you’d completely miss this. You might keep pouring money into underperforming ads while neglecting the very channel that’s driving profitable, sustainable growth.
Here are a few essential ways to start segmenting your sales growth:
- By Channel: Compare growth from Meta Ads vs. Google Ads vs. Klaviyo email campaigns.
- By Customer Cohort: Are new customers or returning customers driving your growth? The answer is critical for balancing your acquisition and retention efforts.
- By Product Category: Is a new product line responsible for the entire lift while your core offerings are flat?
Trying to create these segments manually in a spreadsheet is tedious and a recipe for errors. This is another area where a dedicated analytics tool becomes a non-negotiable for a growing brand. It can instantly segment your data, letting you ask deeper questions and get immediate answers—turning a flat number into a rich, actionable story about what’s really moving the needle.
Automating Your Growth Metrics for Actionable Insights
Manually crunching sales growth numbers in a spreadsheet is a necessary starting point, but let’s be honest—it’s not the end game. Wrestling with exports and formulas is slow, a magnet for human error, and worst of all, it only tells you what happened. It almost never gives you the why or the actionable what's next.
This is where a modern analytics platform stops being a calculator and becomes a genuine growth co-pilot for your Shopify brand.
The real leap forward for DTC operators isn't just about calculating faster; it's about closing the gap between seeing a number and making a confident decision. When your data is unified and your growth metrics are calculated automatically, you get your time and mental energy back to focus on strategy, not data entry.

It means no more exporting CSVs or debugging formulas. Just a single source of truth you can actually trust to guide your next move.
From Static Reports to Conversational Analytics
Imagine you could just ask your data a question and get an instant, accurate answer. That’s the idea behind conversational analytics, and it completely changes the game for how you interact with your business's performance.
Instead of navigating clunky dashboards or filtering endless spreadsheets, you can just ask in plain English:
- "What was our MoM net sales growth for the new skincare line?"
- "Compare YoY growth for Q2 between our Meta ads and Google Ads."
- "Show me our top 10 products by sales growth last month."
This isn't some far-off concept; it’s a real-world tool for busy founders. An AI-powered platform like MetricMosaic’s MosaicLive turns your complex Shopify data into a simple conversation. You get immediate clarity without needing to be a data analyst, transforming what used to be a time-sucking research task into a two-second query. That speed lets you follow your curiosity and uncover growth opportunities that would otherwise stay buried in raw data.
Turning Calculations Into Proactive Insights
The most powerful tools don’t just answer your questions—they tell you which questions you should be asking. They move beyond reactive reporting to surface proactive, story-driven insights that grab your attention. This is where AI really starts to feel like a strategic partner.
A simple sales growth calculation is just a number. An AI-driven insight, on the other hand, connects that number to other critical metrics to automatically reveal the story behind the data.
Instead of just seeing that your YoY growth is down 5%, a proactive system will tell you why. It might surface an alert like: "Your Year-over-Year sales growth has decreased by 5% this month. This was driven by a 15% drop in performance from your top Meta ad campaign, where your ROAS has also fallen from 3.2x to 1.8x."
See the difference? The first scenario gives you a problem; the second gives you a diagnosis and a clear starting point for a fix. It connects the dots between sales, marketing spend, and profitability, turning a basic calculation into a strategic alert you can act on immediately.
Connecting Growth to LTV and Profitability
Ultimately, we calculate sales growth because we want to drive profitable, long-term expansion. Real growth isn't just about juicing top-line revenue; it's about acquiring high-value customers who actually stick around. An automated platform makes this connection seamless.
By unifying data from your Shopify store, your ad platforms, and email tools like Klaviyo, you can instantly see how growth impacts the metrics that truly define business health:
- Customer Lifetime Value (LTV): Are the customers you acquired during a high-growth month churning out, or are they becoming loyal fans with a high LTV?
- Customer Acquisition Cost (CAC): How is your CAC trending as you scale? An AI co-pilot can flag when your growth is getting too expensive to sustain.
- Profitability: The system can automatically link sales growth back to product margins and ad spend, ensuring you’re chasing profitable growth, not just revenue for revenue’s sake.
This holistic view positions your analytics as the central nervous system of your business. Every sales growth calculation becomes a piece of a much larger story, helping you balance short-term wins with the long-term, sustainable success of your Shopify brand.
Answering Your Top Sales Growth Questions
Once you’ve got the formulas down, the real questions start popping up. You start plugging in your own Shopify numbers and things get… complicated. We’ve been there.
Here are a few of the most common questions we hear from founders and operators, along with our straight-up answers.
What’s a “Good” Sales Growth Rate for a Shopify Store?
This is the million-dollar question. And the honest-to-goodness answer is: it depends. A good growth rate is entirely relative to your brand’s stage, your industry, and where you're trying to go.
- Early-Stage Brands (Under $1M ARR): When you're just starting to get traction, seeing 100-200% YoY growth (or even more) isn't unheard of. You're finding product-market fit and lighting up your first few marketing channels.
- Growth-Stage Brands ($1M-$10M ARR): Here, things start to professionalize. A strong, sustainable growth rate often lands in the 40-80% YoY range. The game shifts from pure explosion to more predictable, profitable scaling.
- Mature Brands (Over $10M ARR): At this scale, growth might look more like 15-30% YoY. But don't be fooled by the smaller percentage—those gains represent huge jumps in real-dollar revenue.
At the end of the day, a "good" growth rate is one that keeps you ahead of your direct competitors and is profitable enough to be sustainable. Don't get caught chasing vanity metrics. Focus on healthy, margin-aware growth.
How Often Should I Be Calculating Sales Growth?
The right cadence depends entirely on the decisions you need to make. Obsessing over daily blips can drive you crazy, but waiting too long means you might miss a huge trend hiding in plain sight.
A smart approach is to sync your analysis with your operational rhythm. Check MoM growth weekly or bi-weekly to see how your campaigns are doing. Look at QoQ trends monthly for tactical planning. Use YoY analysis as your north star during quarterly and annual strategy sessions.
What If My Sales Growth Goes Negative?
First off, don't panic. Negative growth is a signal, not a death sentence. It’s a sign that it's time to dig in and understand the "why."
This is where the segmentation we talked about earlier becomes crucial. Is the drop happening across the entire store, or is it isolated to one channel or product line? A single month of negative YoY growth might just mean you ran a monster, one-off campaign this time last year. But if you see a consistent downward trend, it's time for immediate action.
This is exactly where an AI-powered platform can be a lifesaver. Instead of you spending hours digging through spreadsheets, it can pinpoint the source of the trouble in seconds—maybe a drop in ROAS from a key ad channel or higher churn from a recent customer cohort. It turns a scary number into a clear, actionable starting point.
Ready to stop wrestling with spreadsheets and start getting actionable answers from your data? MetricMosaic unifies all your Shopify data to deliver story-driven insights that actually move the needle. Start your free trial today.