LTV CAC Ratio: A Shopify DTC Guide to AI-Powered Growth
Learn to calculate and optimize your ltv cac ratio for Shopify and DTC brands with practical AI analytics, benchmarks, and real-world examples.

Running a Shopify store often means hopping between siloed dashboards—ad spend in Google Ads, email performance in Klaviyo, Shopify orders in yet another portal. Fragmented data, conflicting reports, and unclear ROI make even simple growth decisions feel like a gamble. For busy DTC founders and operators who crave clarity and scalable results, AI-powered analytics offer a faster path from data chaos to confident strategy.
In this guide, we’ll demystify the LTV:CAC ratio and show how conversational analytics, predictive insights, and story-driven data can replace manual data crunching. You’ll walk away with practical steps to improve ROAS, CAC, AOV, LTV, retention, and profitability—using next-gen tools that automate and illuminate your Shopify metrics.
Quick Overview Of LTV CAC Ratio
At its core, the LTV:CAC ratio answers a simple question: How many dollars in customer lifetime value return for every dollar you spend acquiring that customer? On Shopify, hitting around a 3 : 1 ratio usually means you’re fueling growth without drowning your cash flow.
Think of it like tending a garden. You scatter marketing seeds (your CAC), water and nurture them (engagement, retention), then eventually harvest a fruitful customer tree (LTV). Get the balance right, and your investment blossoms.
Key LTV CAC Ratio Benchmarks
Below is a quick reference to see where your brand stands:
| Benchmark | Meaning | Recommended Range |
|---|---|---|
| Under 2 : 1 | At-risk spend | < 2 : 1 |
| 2 : 1–3 : 1 | Modest growth | 2 : 1–3 : 1 |
| 3 : 1 (Optimal) | Healthy, investable | 3 : 1 |
| 4 : 1–5 : 1 | Strong profit, possible underinvest | 4 : 1–5 : 1 |
| Above 5 : 1 | Underinvestment in growth | > 5 : 1 |
Many analysts have pointed to a 3 : 1 LTV:CAC as the baseline for a sustainable, investable e-commerce brand. Ratios below 2 : 1 often ring alarm bells, while anything north of 5 : 1 can hint that you’re holding back on growth. Learn more on Lucidchart.
Keep these benchmarks front of mind as you tweak ad bids, nurture email flows, and ramp up loyalty efforts.
Understanding Benchmark Implications
- Under 2 : 1 drains cash and spooks investors.
- 3 : 1 strikes the right balance between reinvestment and profit.
- Above 5 : 1 could mean you’re not pushing hard enough on growth.
Ratios below 2 : 1 signal unsustainable spending, while those above 5 : 1 suggest missed growth opportunities.
Here’s what a typical LTV:CAC distribution looks like across Shopify brands. The chart below highlights benchmark clusters and outliers for DTC ecommerce growth.

Most Shopify merchants tend to stabilize near a 3 : 1 ratio, reinforcing that sweet spot.
Use these insights to align your ad spend and customer retention tactics—so every marketing dollar stretches further and fuels scalable, profitable growth.
Understanding LTV And CAC Basics
Running a Shopify store often feels like you’re juggling separate spreadsheets for marketing, sales, and customer data. Reports sit in different silos, hiding the real impact of every dollar spent.
Lifetime Value (LTV) tracks the total profit you expect from each customer over time. Customer Acquisition Cost (CAC) tallies every marketing and sales dollar needed to secure a new buyer. Together, they form the backbone of any growth strategy.
Coffee Shop Analogy
Think of it as your local café. Each regular comes in for a latte every week, and small tweaks—like a loyalty punch card or a seasonal flavor—can spark a noticeable bump in their lifetime spend.
- Seed Planting: CAC is like paying rent and utilities to draw customers through the door.
- Tree Growth: LTV measures the cups they buy as they become loyal supporters.
- Harvest Check: The LTV CAC Ratio shows if your initial costs sprout into lasting profit.
When that ratio hits 3 : 1, it usually means your acquisition seeds are taking root and yielding solid returns.
Using AI To Unite Shopify Metrics
Stitching orders, ad spend, and returns into one spreadsheet can eat up hours every week. MetricMosaic takes the pain out by pulling data from Shopify, GA4, Klaviyo, and ad platforms into a single, story-driven dashboard.
Conversational analytics weave fragmented numbers into a cohesive narrative, so you can zero in on growth.
Need to know your blended LTV CAC ratio this month? Ask in plain English, “What’s my blended LTV:CAC for October?” and get an interactive chart with predictive insights in seconds—no formulas required.
Preparing Data For Smarter Insights
Accurate metrics start with clean data. If your channel tags are inconsistent or refunds sneak in unnoticed, your ratio can swing wildly.
- Merge sales and marketing spend into one unified view.
- Apply your gross margin to each order before calculating LTV.
- Standardize acquisition channel tags for true CAC tracking.
With those steps in place, your LTV CAC Ratio stays consistent across cohorts and reporting periods.
Why LTV CAC Ratio Matters
Balancing LTV against CAC helps you see whether your store is building profit or burning cash. A robust ratio tells you when to scale, pause, or pivot.
- Increased Budget Confidence: Ramp up ad spend with clear ROI signals.
- Profit Visibility: Understand gross profit per customer to protect margins.
- Retention Focus: Spot the right time to invest in loyalty before costs spike.
- Data-Driven Decisions: Ground your strategy in numbers, not guesses.
- Investor Appeal: A strong ratio speaks volumes in funding conversations.
Track both metrics together, or risk hiding hidden costs. MetricMosaic brings these insights to life with predictive analytics and automated dashboards—no manual formulas needed.
Key Data Pitfalls To Avoid
Even small data mistakes can distort your ratio and send your strategy off course.
- Incomplete Data: Missing refunds can understate CAC or overstate LTV.
- Overlapping Channels: Counting the same ad spend twice inflates your costs.
- Static Cohorts: Ignoring changes in customer cohorts blurs true lifetime trends.
Steering clear of these traps keeps your LTV CAC Ratio accurate, timely, and actionable.
Now that you’ve mastered the basics of LTV and CAC, you’re ready for formulas and real Shopify examples. Let’s dive in next.
Calculating LTV:CAC Ratio In Ecommerce
Keeping formulas scattered across sheets is a headache for any Shopify founder. In this hands-on guide, we’ll build your understanding step by step—from blended and cohort LTV to gross margin effects and payback period scenarios.
We’ll plug in a $200 average order value at 25% margin and see how a six-month payback target shifts your LTV:CAC ratio. By the end, you’ll run these numbers in MetricMosaic without juggling tabs or risking manual errors.
Here’s what’s ahead:
- Blended vs. cohort LTV explained
- Margin and purchase-frequency experiments
- Payback period calculations
- Real-time automation in MetricMosaic
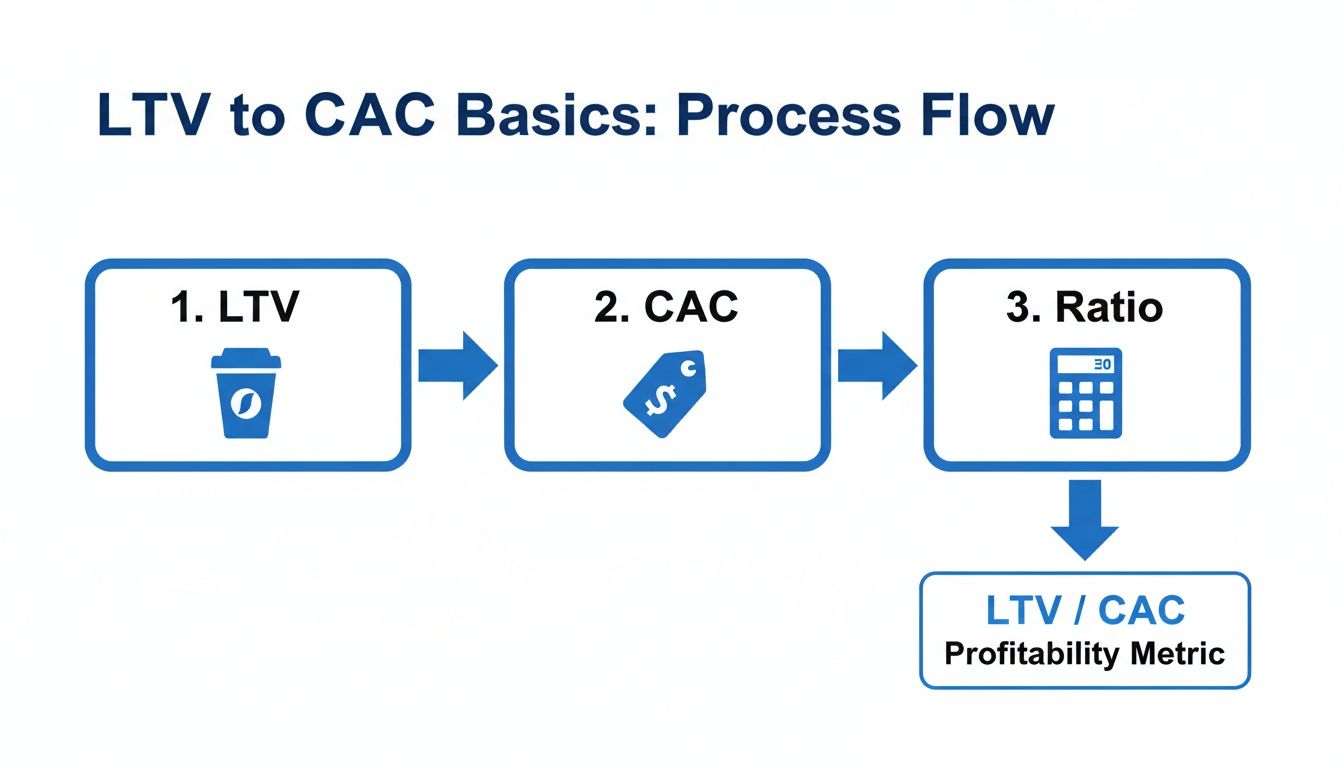
The coffee cup icon represents LTV, the price tag marks CAC, and the calculator shows the final ratio—laid out in a clear left-to-right flow.
Blended Versus Cohort LTV
Blended LTV rolls every customer’s lifetime profit into a single number—think of it as the average height of trees in your orchard. Cohort LTV, by contrast, slices your customers into groups (by month, channel or source) to highlight soil-quality differences.
- Blended LTV Formula
Average Order Value × Purchase Frequency × Gross Margin - Cohort LTV Formula
Sum of Cohort Gross Profit ÷ Number of Customers
Use blended LTV for a quick health check. Switch to cohort LTV when you need to zero in on which channels or signup months deliver the most value.
Testing Margin And Frequency Impact
Gross margin drives your LTV math. At 25% margin on a $200 order, you pocket $50 per purchase. With three buys per customer, blended LTV hits $150.
Increase margin to 30% and that same purchase frequency lifts blended LTV to $180—all without changing your marketing mix.
Bump average orders from three to four at 25% margin, and you’re looking at $200 in LTV.
Running “what-if” scenarios like this in MetricMosaic can be as simple as typing, “What happens if margin jumps to 35%?” Instant, AI-driven feedback shines a light on whether you should tweak pricing, renegotiate supplier costs, or introduce new bundles.
Comparison Of LTV CAC Calculation Methods
Below is a side-by-side look at the three main ways to calculate LTV and CAC. Pick the one that fits your goal—overall health, channel deep-dives, or cash-flow planning.
| Method | Formula | Use Case |
|---|---|---|
| Blended LTV | AOV × Frequency × Margin | Fast, high-level profitability check |
| Cohort LTV | Sum Gross Profit of Cohort ÷ Cohort Size | Channel and time-period performance |
| Payback Period | CAC ÷ (Monthly Gross Profit per Customer) | Forecasting cash-flow and pacing spend |
Each method shines in its own scenario: blended for broad health, cohort for targeted tests, payback for budgeting accuracy.
LTV CAC Payback Period
Payback period tells you how many months it takes to recover your CAC through gross profit. If your CAC is $100 and each customer generates $50 per month in gross profit, payback arrives in two months.
A six-month payback target helps you flag customers who hit profitable thresholds quickly—and identify those that drag on cash flow.
Key steps:
- Map CAC and monthly profits per channel
- Highlight cohorts that meet payback goals within your window
- Adjust bids on any underperforming sources
With a shorter payback, you unlock cash sooner and avoid budget bottlenecks.
Reproducing These Calculations In MetricMosaic
Getting these numbers out of your head and into a dashboard is straightforward. Link your Shopify store, set your margin and payback targets, and let MetricMosaic compute both blended and cohort LTV in real time.
Orders, refunds and ad-spend data sync automatically, so your dashboards update on the fly. Want to compare a new cohort or run a “margin at 35%” scenario? Just ask in plain English.
From here on out, calculating and optimizing your LTV:CAC ratio becomes a repeatable, data-driven cornerstone of your growth strategy. Ready to see it in action? Start your MetricMosaic trial.
Benchmarking LTV CAC Ratio For Shopify Brands
If you don’t pin down realistic targets, ad dollars can slip through your fingers and budgets suddenly spring leaks.
Most Shopify stores see an LTV around $300–$450, paired with a CAC of $100–$150. That lands them near a 3:1 return—but rising ad costs have nudged those figures higher.
A steady 3:1 ratio remains your guiding star, even if the dollar values need fine-tuning.
Shopify Brand Benchmarks
| Model | Typical LTV | Typical CAC | Ratio |
|---|---|---|---|
| B2C Ecommerce | $300–$450 | $50–$150 | 3:1 |
| B2B SaaS | $1,200–$3,000 | $300–$1,000 | 3:1–4:1 |
For most DTC lines—think skincare or gourmet snacks—an LTV in the $300–$450 band is standard. Meanwhile, rising auction prices on Facebook Ads and Google Ads have pushed CAC to the $100–$150 range.
By contrast, B2B SaaS teams can stomach higher CACs thanks to long contracts and upsells. Ecommerce brands, with LTV between $150–$450, must keep CAC at $50–$150 to hold a 3:1 ratio. Learn more about SaaS vs Ecommerce metrics on Data Mania.
Identifying Red Flags In Your Ratio
Spotting a drift in your LTV:CAC ratio is like seeing dark clouds on the horizon—it’s easier to course-correct early.
- CAC jumps without a matching LTV boost? You might be hitting ad fatigue or targeting the wrong audience.
- A slipping ratio over weeks often ties back to higher refunds or fewer repeat orders.
- Ratios north of 5:1 can actually mean you’re playing it too safe and missing growth chances.
When you see warning signs, drill down into channel cohorts and refund logs. Slice each source by month to find the culprit.
Applying Benchmarks To Your Strategy
Turn these benchmarks into a monthly health check for every channel:
- Measure each channel’s current LTV:CAC against the 3:1 goal.
- Pull back spend on ads where CAC tops $150 without quick returns.
- Boost average order value through bundles, cross-sells and tiered discounts.
- Roll out loyalty or subscription flows to lift repurchase rates and stretch LTV.
Plug these steps into MetricMosaic for automated tracking, predictive benchmarking, and alerts. With conversational analytics, you can simply ask, “How’s our CAC stacking up against industry benchmarks?” and get instant charts.
Automating your benchmark checks means you catch ratio dips before they turn into cash-flow headaches.
Mapping actual performance against these Shopify-specific LTV:CAC benchmarks shines a light on where to scale, hold fire, or double down on high-impact tactics.
Tailoring Benchmarks By Product Category
Every niche on Shopify has its own flavor—so your benchmarks should too:
- Consumables: Fast repurchases boost LTV, but you need strict CAC controls to protect margins.
- Apparel & Accessories: Seasonal spikes can send CAC soaring around holidays—plan bid caps in advance.
- Digital Products: With near-zero variable costs, you can afford a richer CAC budget without killing profitability.
Match your store’s quirks to these category patterns and dial in LTV:CAC targets with laser focus.
Using AI For Real-Time Benchmarking
MetricMosaic’s predictive engine alerts you the moment CAC trends threaten LTV:CAC goals. Its narrative-style automation then suggests budget shifts or retention pushes long before ratios slip.
By applying AI-driven benchmarking and story-driven data, you turn reactive reporting into a proactive growth engine. Next steps: set up custom alerts in MetricMosaic and schedule a weekly ratio review to keep everything on track.
Start benchmarking today to stay one step ahead of rising ad costs and lock in profitable growth.
Strategies To Improve LTV CAC Ratio
Think of your LTV:CAC ratio as the yardstick for every marketing dollar you spend. Even a small lift in average order value or a slight bump in retention can move that meter by dozens of points—especially for Shopify brands. With MetricMosaic, you can tackle three core levers right now:
- Raise Average Order Value through bundles, upsells, and cross-sells
- Boost Retention with trigger emails, loyalty points, and subscriptions
- Trim CAC by reallocating budgets, testing creatives, and using data-driven attribution
MetricMosaic’s conversational analytics highlight which products pair best in bundles, comb through margins, and recommend upsells so you skip the guesswork.
Increase Average Order Value
Pushing up AOV is like encouraging a customer to upgrade from drip coffee to a latte—more revenue without extra ad spend. Imagine a bundle that tacks on $15 to a $60 cart; that’s a 25% jump in LTV, instantly.
- Offer tiered bundles with escalating rewards
- Surface personalized picks for high-value segments
- Set free-shipping thresholds to nudge carts over your goal
- Identify top-margin items in MetricMosaic
- Let the platform suggest ideal bundles via AI insights
- Monitor real-time AOV changes and tweak offers
Timing matters: presenting an upsell at checkout or in post-purchase emails can lift acceptance rates by 20%. One Shopify beauty brand watched their AOV climb from $75 to $89 in just a month after introducing a single-item bundle.
Strengthen Customer Retention
Keeping customers longer drives LTV faster than chasing new ones. Trigger-based email flows welcome first-time buyers, recover abandoned carts, and re-engage silent shoppers.
Loyal customers are five times more likely to repurchase, turning one sale into many.
- Launch a post-purchase series with usage tips and next-order incentives
- Roll out a point-based loyalty program to reward repeat buys
- Introduce subscription options for consumable products
MetricMosaic analyzes order rhythms to flag at-risk segments before they churn. A Shopify snack label, for example, saw a 12% lift in repeat purchases after adding a two-step winback flow—proof that small tweaks can yield big gains.
Lower Customer Acquisition Cost
Reducing CAC frees up budget to double down on high-ROI channels. AI-driven attribution reveals which ads, audiences, or creatives drive the lowest true cost per customer.
When one Shopify snack brand shifted 20% of spend from underperforming ads to their top 20%, they cut CAC by 15% in a single quarter.
| Spend Allocation | CAC Before | CAC After |
|---|---|---|
| Top 20% Ads | $110 | $95 |
| Remaining 80% Ads | $140 | $120 |
- Auto-allocate budget to ads under your CAC threshold
- Run creative A/B tests directly in MetricMosaic
- Target lookalike segments built from your highest-LTV customers
MetricMosaic also tracks ad fatigue—when frequency climbs and clicks drop, it alerts you to refresh creatives, often chopping 5% off CAC without extra spend.
Next Steps To Take
- Set clear lift targets for AOV, retention, and CAC in MetricMosaic
- Schedule weekly dashboard reviews and custom alerts
- Test two tactics at once to isolate what works
- Double down on winning bundles and email flows using AI insights
Pulling these moves together triggers a compound effect: higher LTV, lower CAC, and a healthier ratio overall. Start your free trial to roll out these tactics and see your profitability climb.
These approaches scale with your store size, from niche DTC lines to high-volume Shopify Plus brands and multi-channel operations.
Common Mistakes When Assessing LTV:CAC Ratio
Even seasoned Shopify founders can stumble when their data lives in silos or attribution tags break down. It often happens when one-off promotions get lumped together with evergreen campaigns. The result? Budgets bleed out and true profitability stays hidden.
A tiny slip in data cleaning or channel tagging can throw off both LTV and CAC. You might think you’re sitting on a 3:1 ratio—only to find a 20% jump in CAC later. Those surprises can unravel quarterly plans and drain your cash reserves in no time.
Take a DTC beauty brand that went all-in on a fan-recruitment flow. At first glance, it looked like viral magic. In reality, CAC shot up by 40% while LTV barely budged once churn and refunds came through. Chasing spikes without tracking real conversions is a quick path to wasted traffic.
Catching these anomalies early can save you thousands in ad spend. Pinpoint the root cause and keep your growth engine humming.
Pitfalls In Ad Spend Attribution
Your CAC is only as accurate as your spend data. Missing a few cents here and there can shift your LTV:CAC ratio dramatically.
Granular tracking links and unique campaign tags help you see exactly where each dollar lands.
- Mixing paid ads and organic traffic into one bucket
- Ignoring platform fees that quietly inflate costs
- Leaving test campaigns tangled with long-term channels
Even a 5% misallocation can skew your ratio by 0.3 points.
Overlooking Returns And Refunds
Refunds and returns carve directly into your lifetime revenue. If you forget to strip them out, your LTV balloons on paper but not in profit.
For example, when 10% of orders come back, your lifetime gross profit takes a serious hit. Always subtract refund value before you lock in your cohort LTV.
Excluding refund value from LTV keeps your LTV:CAC ratio honest and reliable.
- Flag returned orders in your dashboard
- Exclude partial refunds from cohort calculations
- Automate adjustments with MetricMosaic to sync post-purchase data
Relying Only On Blended Metrics
Blended LTV rolls every cohort into one smooth number. It tames the peaks but buries the valleys.
Blended and cohort metrics each tell a different story—treat them as separate chapters.
| Mistake | Impact | Fix |
|---|---|---|
| Blended LTV Only | Hides channel dips | Run cohort analysis monthly |
| Ignoring Channel Overlap | Counts same spend twice | Use unique campaign tags |
| Static Measurement Window | Misses long-tail customer value | Adjust timeframes per cohort |
Ignoring Seasonality And Cohort Shifts
Holiday pushes or one-off events can send both LTV and CAC soaring—unless you adjust your measurement window.
- Break out metrics by month and channel
- Compare the same periods year-over-year
- Use MetricMosaic’s predictive alerts to flag sudden shifts
Tracking cohorts alongside seasonal trends keeps your ratio accurate, rather than relying on stale averages.
Next Steps To Correct Your Ratio
Fine-tuning your LTV:CAC ratio starts with a straightforward audit and repeatable process.
- Audit channel spend tags and factor in platform fees
- Include returns and refunds in both LTV and CAC calculations
- Run blended and cohort analyses side by side
- Schedule weekly ratio reviews using MetricMosaic Stories
Consistency and automation protect your margins. Tackle these mistakes now, and every dollar you spend will move the needle on your Shopify growth.
FAQ
Below you’ll find clear, hands-on answers to the most pressing questions about keeping a healthy LTV:CAC Ratio on your Shopify store.
- Benchmark thresholds for sustainable growth
- Choosing between blended and cohort calculations
- Recommended monitoring cadence to catch trends early
- AI-powered tools that automate ratio tracking
What Is The Ideal LTV:CAC Ratio For A Shopify Store
A solid LTV:CAC Ratio sits around 3:1. In plain terms, every dollar you spend on acquisition should return three dollars in lifetime gross profit.
If you’re below 2:1, it can strain cash flow. On the flip side, anything above 5:1 usually means you’re underinvesting in growth.
How Do You Calculate LTV:CAC Ratio Accurately
First, figure out your customer lifetime value (LTV). That’s margin-adjusted revenue per shopper over their entire relationship with your brand.
Next, calculate customer acquisition cost (CAC) by dividing total marketing and sales spend by the number of new customers.
For extra clarity:
- Blended LTV:CAC gives a quick snapshot but can hide channel differences.
- Cohort LTV:CAC breaks down performance by acquisition month or channel.
Cohort analysis often shows that a channel that sparked fast growth early on may fizzle if you don’t layer in retention tactics.
What Monitoring Cadence Works Best
Make it a habit to review your LTV:CAC Ratio every month. That keeps you on top of any sudden ad-performance swings or budget bloat.
Then dive deeper each quarter. Use those insights to refine retention flows and to model your next year’s growth trajectory.
Which Tools Automate LTV:CAC Tracking
Look for a platform that pulls from Shopify, GA4, Meta Ads, and Klaviyo without manual exports. That way, you spend less time wrestling spreadsheets.
MetricMosaic offers:
- Automatic data sync from Shopify, GA4, Meta Ads, and Klaviyo
- Plain-English queries so you can chat with your metrics in seconds
- Custom alerts for ratio dips, payback delays, and other red flags
With everything in one dashboard, you’ll catch issues sooner and focus on strategies that actually move the needle.
Manual Vs Automated Tracking
| Method | Efficiency | Error Risk |
|---|---|---|
| Manual Spreadsheets | Low | High |
| AI-Powered Automation | High | Low |
- Save hours each week by auto-syncing data across channels
- Spot performance anomalies flagged instantly by AI alerts
- Redirect your team’s energy toward growth strategies, not data cleanup
Implementing automated LTV:CAC tracking can surface hidden revenue opportunities. Small tweaks compound into major profitability boosts.
Use these FAQs as your go-to reference when you’re logging into MetricMosaic dashboards. Adjust bids or retention flows at the first warning sign.
Happy optimizing and scaling!
Ready to streamline your LTV:CAC management? Try MetricMosaic, Inc. now: https://www.metricmosaic.io