Improve Your Shopify Conversion Rate with AI-Powered Growth Insights
Discover how to improve shopify conversion rate with AI analytics and smart experiments that turn data into a clear DTC growth roadmap.
You're pouring money into Meta and Google ads, driving traffic to your Shopify store, but the sales just aren't keeping up. It feels like you're trying to fill a leaky bucket—visitors land on your site, click around, and then vanish. It's a frustratingly common challenge for DTC founders trying to scale.
The real issue? Your data is fragmented. You have Shopify, GA4, Klaviyo, and your ad platforms all telling you different parts of the story. Stitching it together to see where customers are actually leaving is nearly impossible. This leads to unreliable reports, unclear ROI, and a lot of guesswork that wastes ad spend and leaves revenue on the table.
This isn't another checklist of generic CRO tips. This is a founder-friendly, data-first framework for systematically finding and fixing the real conversion killers holding your Shopify brand back, using the power of AI to transform complexity into clarity.
The Real Cost of an "Average" Conversion Rate
The gap between an average Shopify store and a top-performer is massive, representing a huge opportunity for growth.
Most stores hover around a 1.4% conversion rate. Think about that: for every 100 visitors you pay to acquire, maybe one or two actually buy something.
But the top-tier stores? They're converting at over 3.2%, with the best of the best clearing 4.7%. That's more than double the revenue from the exact same traffic. You can get a deeper look into these numbers in this 2025 Shopify benchmarks report.
Shopify Conversion Rate Benchmarks by Performance Tier
Understanding where your store stands against industry benchmarks is the first step. This table shows the performance gap between average and top-tier stores.
| Performance Tier | Average Conversion Rate | Potential Revenue Impact |
|---|---|---|
| Average | 1.4% | Baseline |
| Good | 3.2% | +128% |
| Top 10% | 4.7% | +235% |
Closing this gap is where real growth in ROAS, CAC, and profitability is unlocked. Even a small jump from "average" to "good" can completely change the economics of your DTC business.
The infographic below puts this performance gap into perspective.
As you can see, simply moving from "average" to "good" territory can more than double your revenue without spending a single extra dollar on traffic.
We’re going to walk through how to use unified, AI-driven analytics to find your highest-impact leaks, prioritize experiments that actually move the needle, and start closing that gap for good.
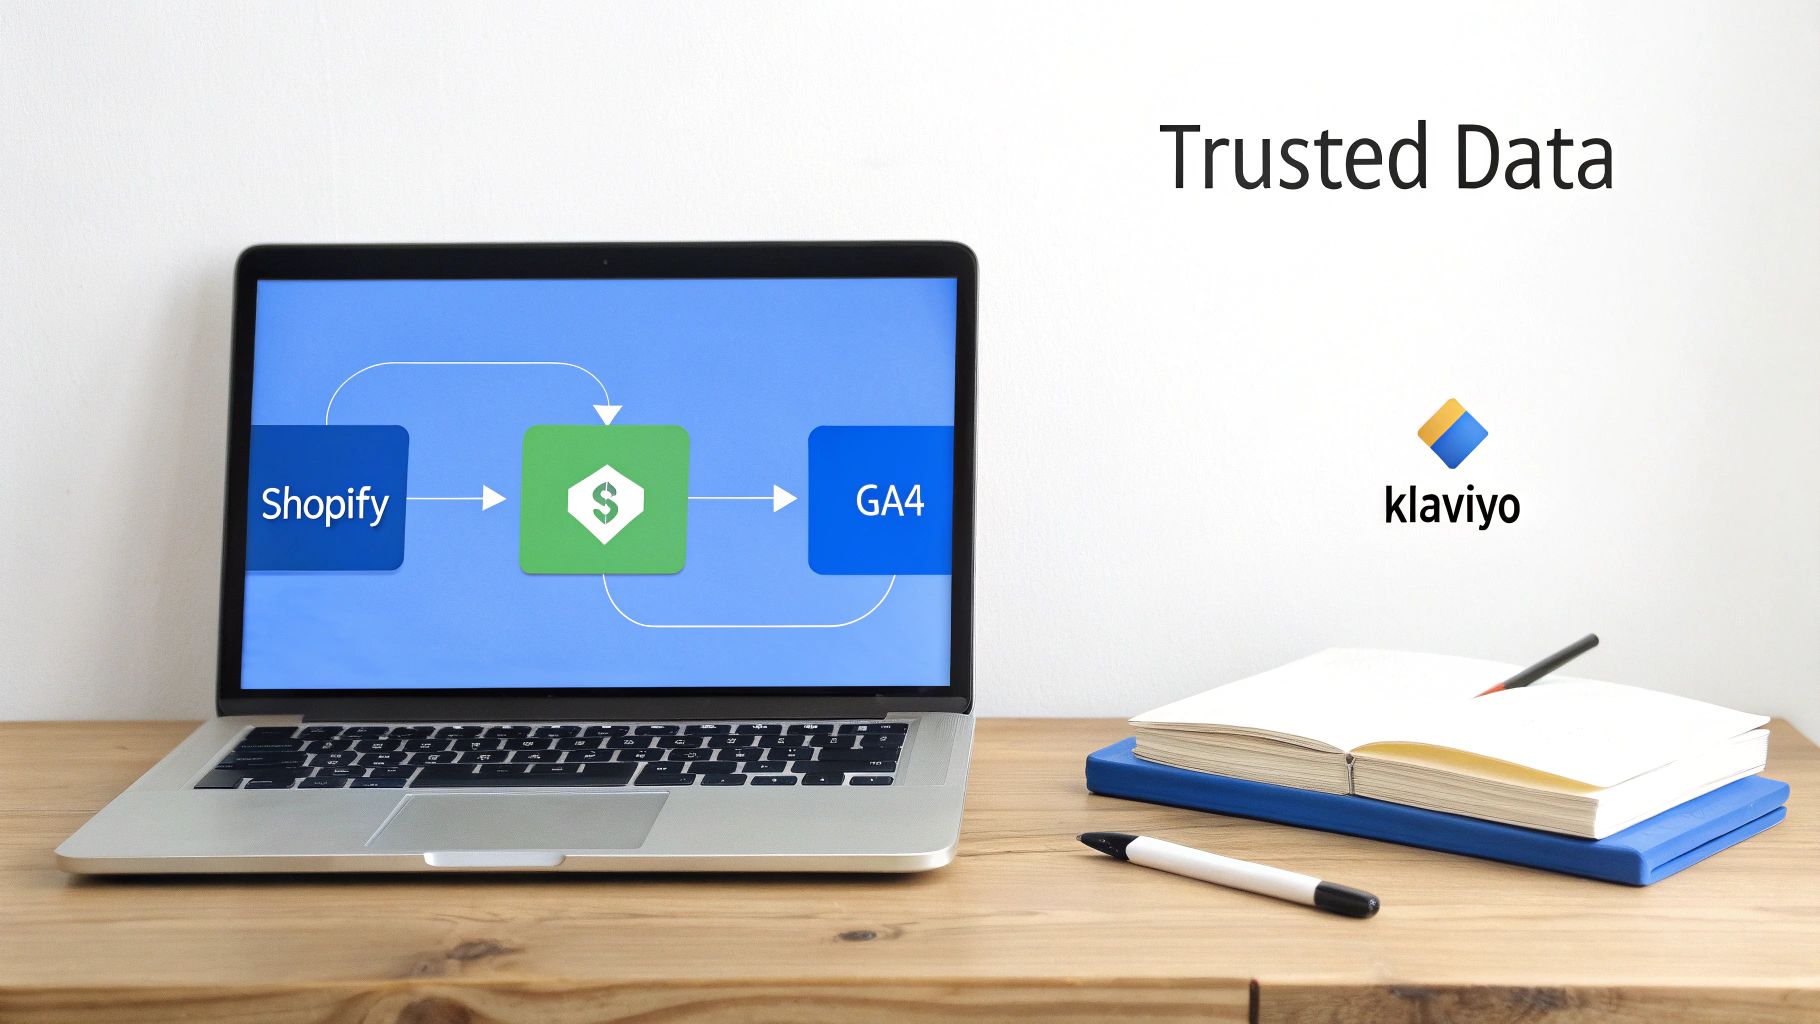
Build Your Foundation With Trustworthy Data
You can't fix what you can't measure. And as a founder, you definitely can't afford to make decisions based on data you don't trust.
Before you A/B test a button color or rewrite product descriptions, the single most important step to improve your Shopify conversion rate is getting your data house in order. For most DTC operators, this is where the overwhelm sets in—a tangled mess of dashboards that all tell a different story.
Shopify shows one number for sessions. GA4 shows another. And Meta Ads Manager is busy taking credit for sales that Shopify attributes somewhere else entirely. This isn't just an annoying discrepancy; it's a foundational business problem. When your data is a mess, every decision is a shot in the dark. This is where most CRO efforts go wrong—right at the starting line.
From Manual Crunching To AI-Powered Clarity
The old way to fix this was a nightmare of exporting CSVs, wrangling VLOOKUPs in giant spreadsheets, and spending hours trying to stitch it all together. It’s slow, prone to human error, and a massive time-suck for any growing brand. That manual data crunching is precisely what keeps you from making quick, confident decisions.
Thankfully, AI simplifies this. Next-generation analytics platforms like MetricMosaic automate this entire process. By plugging directly into your core DTC stack—Shopify, GA4, Klaviyo, and Meta Ads—they create a single source of truth. This isn’t about making life a little easier; it’s about building a unified data model that understands the entire customer journey. The AI does the heavy lifting of cleaning and blending your data, so you can focus on strategy, not spreadsheets.
Once your analytics are unified, you stop asking, "Is this data right?" and you start asking, "What should we do with this?" That shift is the absolute cornerstone of effective CRO.
Your Quick Data Audit Checklist
Not sure if your data is reliable? Spend five minutes on this quick check. Major differences are a huge red flag that your foundation is shaky.
- Session & User Mismatch: Pull up session and user counts in Shopify Analytics and GA4 for the last 30 days. Are they more than 5-10% apart? That's a classic sign of a tracking implementation problem.
- Revenue Discrepancies: Compare the total revenue your ad platforms (like Meta) claim to have generated against what Shopify actually recorded. They'll never match perfectly due to different attribution models, but if the numbers are wildly different, something’s broken.
- Transaction Count: Do the number of transactions in GA4 line up with the number of orders in Shopify? If not, your conversion tracking might be firing at the wrong time or missing orders.
- Email-Driven Sales: Look at the revenue Klaviyo attributes to a campaign. Now, check sales data for that same customer segment inside Shopify. Big gaps often point to issues with UTM tracking.
Spotting these problems is the first step. A unified platform automatically flags these discrepancies, ensuring your optimization efforts are built on a rock-solid data foundation.
This unified view also unlocks next-gen trends like conversational analytics. Instead of wrestling with confusing reports, you can just ask questions in plain English. For example, asking your AI analytics co-pilot, "Show me my conversion rate by traffic source last month," gives you an instant, reliable answer. This is how you turn complexity into clarity and make smarter decisions that grow your Shopify store.
Pinpoint Your Highest-Impact Drop-Off Points
Okay, you've got a solid data foundation. Now the real work begins. It’s time to shift from guessing to diagnosing. Your store is leaking revenue—that’s a given—but where are the biggest holes? The goal isn't just to find any drop-off point. It’s to find the ones with the highest financial impact so you can focus your time and money where they’ll actually move the needle on AOV and profitability.
Traditional funnel reports give you a 10,000-foot view: X people saw a product, Y added it to their cart, and Z bought it. It's a start, but it's a blurry, averaged-out picture that doesn't tell you who is dropping off or why. To really fix your conversion rate, you have to trace specific user journeys.
Beyond The Standard Funnel Report
The breakthroughs happen when you start segmenting your funnels by acquisition source, campaign, or customer type. This is where modern, AI-powered analytics really shine. Instead of getting bogged down building complex reports by hand, you get immediate, story-driven data.
Let's say you're running three Meta ad campaigns. A basic funnel might show a 60% drop-off on your product detail pages (PDPs). That’s a problem, but it’s not an actionable one. A more advanced, story-driven analysis surfaces the real insight:
- Campaign A (Prospecting): A 75% PDP drop-off. These new visitors just aren't convinced by your product info.
- Campaign B (Retargeting): Only a 20% PDP drop-off. These folks already know you; they're just coming back for another look.
- Campaign C (Influencer Collab): A massive 90% drop-off, but it's happening at the shipping stage of checkout.
Boom. You've just gone from a vague problem ("high PDP drop-off") to a highly specific, high-impact diagnosis: "Our influencer campaign is driving traffic that gets sticker shock from our shipping fees." This is the kind of clarity that separates struggling Shopify brands from the ones that scale.
Diagnosing The Common Culprits
Once you start slicing your data, you’ll see patterns emerge around a few key drop-off points. Each one tells a different story about your customer experience and points toward a different fix.
- Homepage to Product Page Drop-Off: This usually signals a navigation or product discovery problem. Your messaging might be off, your hero section isn't grabbing attention, or visitors simply can't find what they're looking for.
- Product Page to Add-to-Cart Drop-Off: A classic conversion killer. It means your traffic is qualified enough to find a specific product but isn't convinced enough to buy. This leak points to weak product descriptions, bad photos, a lack of social proof (reviews), or an unclear value prop.
- Add-to-Cart to Checkout Drop-Off: Someone adding an item to their cart is showing serious intent. If they bounce here, it’s often due to friction, or they might be using the cart as a wishlist.
- Checkout Initiation to Purchase Drop-Off: The most painful leak. These customers are this close to giving you money. This drop-off is almost always caused by surprises like unexpected shipping costs, a long form, or not offering a preferred payment option like PayPal or Shop Pay.
We see this all the time. A Shopify store discovers that mobile visitors from their TikTok ads have an 85% abandonment rate the second they see shipping costs. But desktop visitors from organic search? They only have a 15% drop-off at the same stage. This insight tells them the problem isn't the shipping cost itself—it's the expectation mismatch for that specific TikTok audience.
AI-driven platforms are built to surface these kinds of predictive insights automatically. They don't just spit out a chart; they tell you a story, like, "Your new 'Summer Glow' campaign is underperforming due to an abnormally high checkout abandonment rate linked to shipping costs." This turns a mountain of data into a clear, actionable directive.
Run Smarter Experiments, Not Hunches
Now that you’ve pinpointed where your funnel is leaking, it’s time to patch things up. But this isn’t about throwing common CRO tactics at the wall and hoping something sticks. Real, sustainable growth comes from running smart, data-informed experiments that solve the specific problems you’ve already found.
Guesswork is incredibly expensive for a growing DTC brand. It burns through your time and budget, and can even tank your conversion rate if you change the wrong things. Instead, every experiment you run should be a direct answer to a data-backed insight.
This is how you graduate from, "Hey, maybe we should add some trust badges?" to "Our data shows a 75% drop-off on product pages from our new prospecting campaign. Let's test a clear hypothesis to fix that specific problem."

Building Your Hypothesis From the Leak
A strong hypothesis is the bedrock of a successful experiment. Think of it as a simple, testable statement connecting a problem, a solution, and an expected result. The magic is starting with the "why" your data has already handed you.
Let’s walk through a real-world scenario. Your analysis in MetricMosaic shows a painful abandonment rate on your product pages, particularly for mobile users coming from your Meta ads.
- Data Insight: Mobile visitors from Meta spend an average of only 15 seconds on a PDP before they bounce.
- The Problem: You look at your PDP on a phone and realize your product descriptions are giant walls of text—a nightmare on a small screen.
- Your Hypothesis: "If we replace the long text description with a collapsible accordion menu that uses bullet points and a short video, we can increase the Add to Cart rate for mobile users by 10%, because it will make the key benefits much easier to scan and digest."
See the difference? This founder-friendly approach turns a vague issue into a targeted, measurable experiment.
Prioritizing Your Tests for Maximum Impact
You're probably going to find more than one leak. The real challenge for any DTC operator is figuring out where to start. You need a framework for prioritizing experiments that have the highest potential to improve your Shopify conversion rate—and, more importantly, your bottom line.
A simple way to do this is to score each potential test on three key factors:
- Potential Impact: How much revenue is at stake? Fixing a leak at the final checkout step is almost always more valuable than tweaking your "About Us" page.
- Confidence: How sure are you that your hypothesis is right? Strong quantitative data (like a 90% drop-off rate) combined with qualitative data (like customer support tickets) gives you high confidence.
- Ease of Implementation: How much time and technical lift will this take? A quick copy change is far easier than a full checkout redesign.
Your focus should be on the tests that score high on both impact and confidence. These are the experiments that deliver game-changing results.
Don't fall into the trap of only running the easy tests. The highest-impact optimizations often require more effort, but they're the ones that unlock new levels of growth and profitability.
Beyond Conversion Rate: The True Measure of an Experiment
A successful experiment does more than just lift your conversion rate. You have to measure the ripple effects across all your critical business metrics—ROAS, CAC, AOV, LTV, and retention. An offer that spikes conversions sounds great, but not if it craters your profitability.
For instance, say you test offering a 20% discount directly on the product page. Your conversion rate might jump by 30%, which looks like a massive win. But you have to ask the follow-up questions:
- How did it affect Average Order Value (AOV)? Did customers just grab the discounted item and leave, shrinking your average cart size?
- What was the impact on profitability? Did the increase in sales volume actually make up for the hit you took on your margin?
- Did it attract lower-value customers? You need to analyze the Customer Lifetime Value (LTV) of the cohort you acquired. If they never return for a full-price purchase, you just paid for a one-time transaction, not a long-term customer.
By tracking these connected metrics, you get a complete picture of an experiment’s true business impact. This holistic view ensures your efforts to improve your Shopify conversion rate are also driving sustainable, profitable growth.
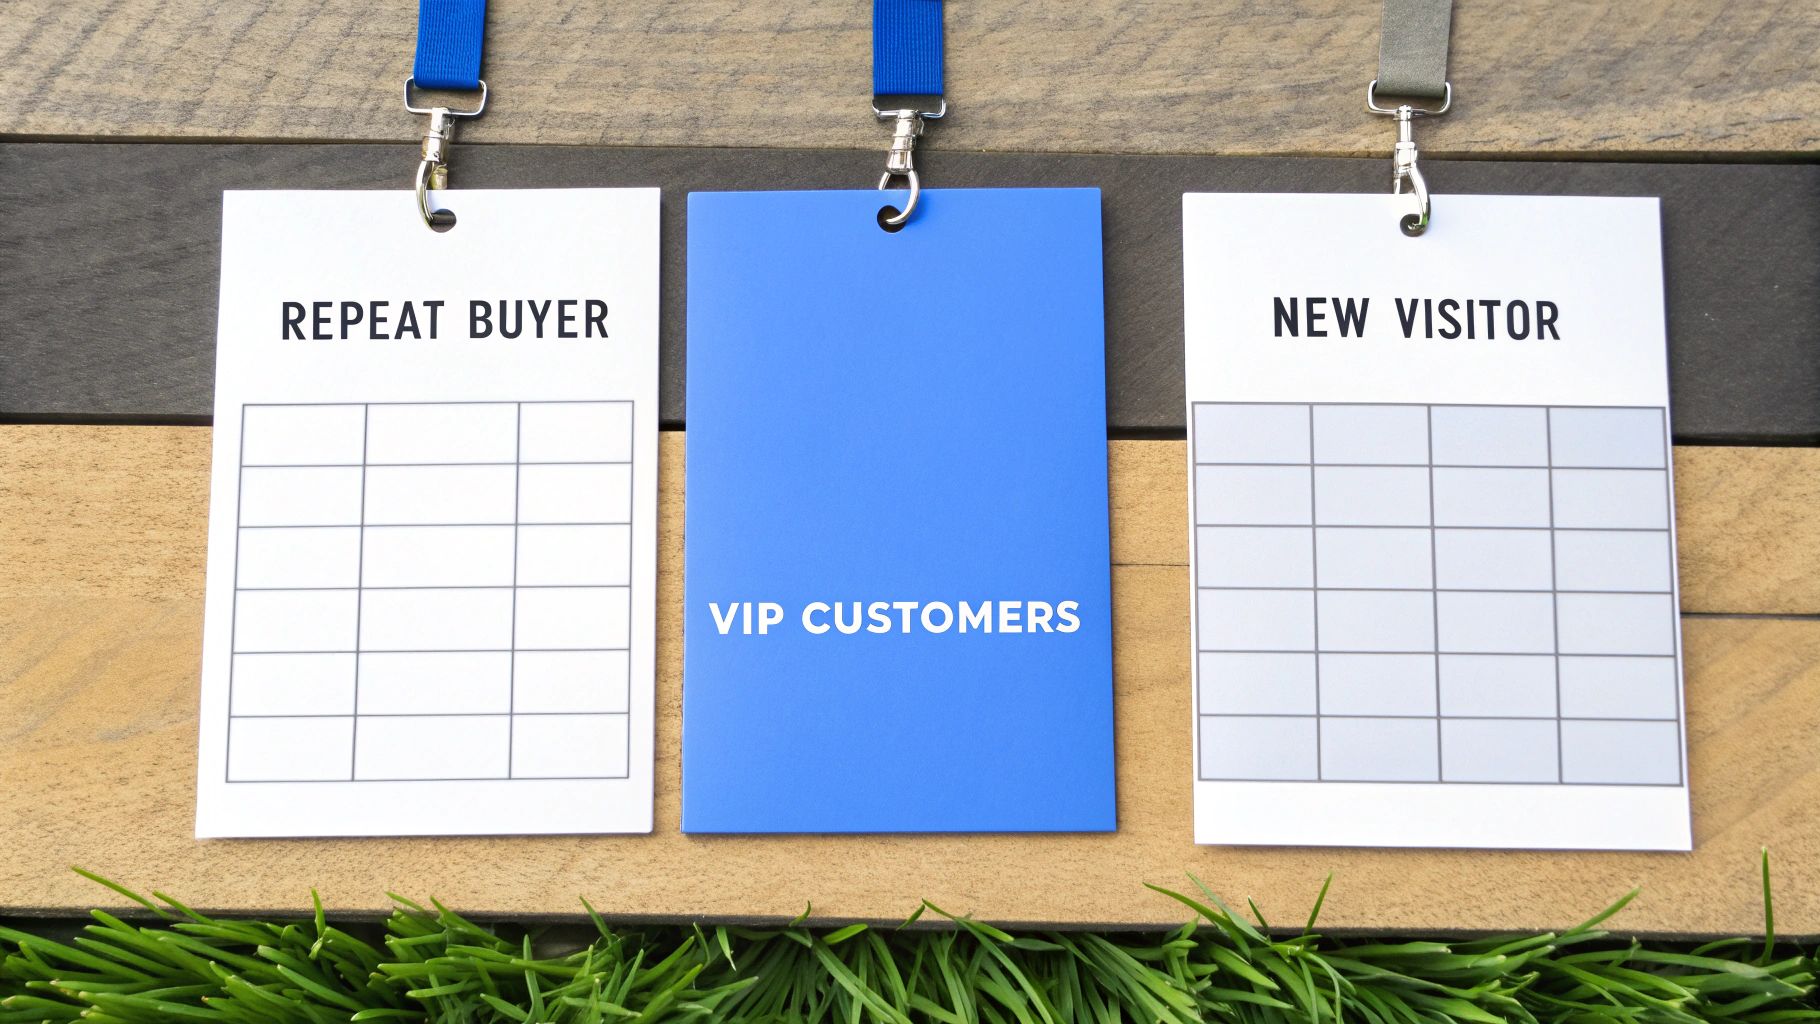
Use Segmentation to Boost Customer Lifetime Value
Relying on a single, store-wide conversion rate is one of the most common—and costly—mistakes Shopify founders make. A blended metric like a 1.4% conversion rate doesn't tell you a story; it hides it.
Buried within that average is a deeper truth: your most loyal customers might be converting at 10%, while first-time visitors from a poorly targeted ad campaign convert at a dismal 0.1%.
When you treat all your customers the same, you’re setting yourself up for wasted ad spend and missed opportunities. The key to unlocking sustainable growth isn't just about lifting your overall conversion rate. It’s about finding and nurturing your most valuable customer segments.
This is where the real power of advanced segmentation comes into play, especially when it's fueled by unified data from all your sources.
Moving Beyond Basic Shopify Segments
Standard segmentation in Shopify might group customers by their purchase history. While that’s a decent starting point, real growth comes from layering in deeper business metrics like Customer Acquisition Cost (CAC) and Lifetime Value (LTV).
This is where an AI-powered analytics platform like MetricMosaic becomes essential. It automates the painful process of blending data from Shopify, Klaviyo, and your ad platforms, letting you build sophisticated segments that would be impossible to create manually. You can finally stop guessing and start knowing who your best customers really are.
Imagine uncovering a segment of customers who were acquired through organic search, made their second purchase within 60 days, and now have an LTV that is 5x higher than your store average. That’s not just a customer group; that's your VIP cohort—your brand's engine for profitable growth.
Turning Segments into Actionable Strategy
Once you've identified these high-value cohorts, the game changes. You can stop marketing to the "average" customer and start creating hyper-personalized experiences that resonate and convert. Your data becomes a playbook for targeted action across AOV, retention, and LTV.
This strategic approach extends to every part of your marketing. Knowing who your best customers are allows you to build lookalike audiences on Meta that are far more effective, directly lowering your CAC and improving ROAS.
Averages tell you what happened, but segments tell you why. Once you understand the 'why' behind your best customers, you can build a repeatable system for creating more of them.
Real-World Examples of Segment-Driven CRO
Let's look at how this plays out in practice. Imagine your data reveals two distinct, high-value segments with completely different behaviors.
Segment A: The High-AOV First-Timers. These customers are acquired via Google Shopping ads. They have a high initial AOV, but a disappointingly low repeat purchase rate.
- Actionable Strategy: Create a targeted Klaviyo post-purchase flow just for them. Instead of a generic "thanks for your order" email, send them a sequence that highlights complementary products and offers a small incentive for their second purchase.
Segment B: The Mobile-First Loyalists. This group shops almost exclusively on mobile, engages with your SMS campaigns, and has a high LTV but a lower AOV.
- Actionable Strategy: Build a dedicated landing page for this segment that's optimized for mobile, featuring a one-click checkout offer via Shop Pay. Send them exclusive SMS alerts about new product drops you know they'll love.
Don't Forget Device-Specific Segmentation
It’s also crucial to analyze behavior based on the device people are using. Most of your traffic is probably coming from mobile, but how is it converting?
This data illustrates the massive optimization opportunity on mobile devices, where most traffic originates but conversion rates lag significantly behind desktop.
| Device | Average Store Conversion Rate | Top 10% Store Conversion Rate |
|---|---|---|
| Desktop | 1.9% | 6.5% |
| Mobile | 1.2% | 3.9% |
These disparities reveal a huge opportunity. Top-performing stores have figured out how to close that gap, and it starts with segmenting and optimizing the mobile experience. For a deeper dive, check out these eCommerce conversion rate benchmarks.
By understanding who your best customers are and how they shop, you can tailor every touchpoint to their preferences. This data-first approach to segmentation is how you systematically improve your Shopify conversion rate while simultaneously boosting LTV and profitability.
Measure True Uplift And Iterate For Continuous Growth
Alright, let's talk about the final, and frankly, the most important piece of the puzzle: measuring what actually worked and building a system for continuous growth.
A successful experiment isn't just about a one-week bump in your conversion rate. It's about fundamentally improving the health and profitability of your entire business. This is how you shift from running one-off projects to building an always-on, data-driven optimization machine.
I see so many Shopify brands make a critical mistake right here. They see a short-term lift and declare victory without ever looking at the downstream effects. The real question isn’t just, "Did the conversion rate go up?" It’s, "What kind of customers did this change bring in, and what did it do to my bottom line?"
Looking Beyond The Conversion Rate
If you genuinely want to improve your Shopify conversion rate for the long haul, you have to measure success holistically. That means tracking not just the immediate uplift, but all the ripple effects on the metrics that define a healthy DTC brand: AOV, LTV, CAC, and overall profitability.
Think about this classic scenario: you test a huge, site-wide 25% off offer. Boom. Your conversion rate shoots up by 40%. On paper, it looks like a home run. But when you dig a little deeper with a unified analytics tool, you see a darker story:
- Average Order Value (AOV): It tanked. Customers cherry-picked the discounted items and nothing else.
- Profitability: Your margins got completely wiped out. You actually lost money despite the higher sales volume.
- Customer Lifetime Value (LTV): The offer attracted a flood of one-and-done bargain hunters who never came back for a full-price purchase.
This is exactly why looking at immediate conversion uplift in a vacuum is so dangerous. You can end up making decisions that feel good in the moment but actively poison your business over time.
The Power of Cohort Analysis
This is where cohort analysis becomes non-negotiable for any serious DTC operator. Instead of looking at blended, store-wide averages, cohort analysis groups customers by when they were acquired (like "customers from the 25% off sale") and tracks their behavior over time.
Cohort analysis tells you the long-term story behind your experiments. It answers the big question: did this change bring us valuable, loyal customers or just a temporary spike in low-quality transactions?
By comparing the LTV and retention of your "discount cohort" against your baseline, you get the real truth. An AI-powered platform like MetricMosaic does this automatically, serving up clear, story-driven insights that show how your experiments really affect customer behavior over weeks and months.
This is the engine of sustainable growth: diagnose with data, experiment with a sharp hypothesis, and measure the true, holistic uplift. Then, do it all over again.
A Few Common Questions
Here are some of the questions that pop up most often when we're talking about using data to lift Shopify conversion rates.
So, What's Actually a "Good" Shopify Conversion Rate?
You’ll see the average Shopify store conversion rate floating around 1.4%. Honestly, as a founder aiming for growth, you can pretty much ignore that number. It’s not the benchmark you should be aiming for.
A genuinely "good" conversion rate starts to kick in around 3.2%. That's where you'll find yourself in the top tier of Shopify brands. If you really want to see what's possible, the elite top 10% of stores are converting at 4.7% or higher.
The biggest takeaway here? The jump from "average" to "good" can literally double your revenue without spending a single extra dollar on traffic. It perfectly illustrates the raw financial power of a smart, data-first approach to improving your store's performance.
How Long Until I Actually See CRO Results?
This is the classic "it depends" question, but for good reason. The timeline for seeing results from conversion rate optimization really varies.
Sometimes, a simple, high-impact fix—like clarifying your shipping costs right before checkout—can produce a measurable lift in just a few days.
But more involved experiments, like a full redesign of your product pages, will naturally take a few weeks to gather enough clean data to call a winner. The real goal isn't just one quick victory. It's about building a continuous loop of testing, measuring, and iterating.
A system for ongoing optimization is infinitely more valuable than any single A/B test. True CRO is a process, not a project.
How Does AI Analytics Give Me a Real Edge?
This is where things get interesting for DTC operators. AI-powered analytics give you a serious advantage by cutting through complexity and delivering speed. Instead of getting bogged down in manual data crunching, AI automatically unifies all your data from Shopify, GA4, your ad platforms, and more. This replaces hours of manual work with instant clarity.
This frees you up to just ask simple questions in plain English and get back reliable answers.
Even better, AI can be proactive. It can surface predictive insights you weren't even looking for—like flagging a specific customer segment with a surprisingly high LTV or pinpointing the exact Meta Ads campaign that's secretly leaking cash. It saves you dozens of hours of manual analysis, letting you skip straight to taking action that actually grows the business.
Ready to move from awareness to action? MetricMosaic is your AI-powered growth co-pilot, turning your complex Shopify data into the clear, actionable insights you need to improve ROAS, LTV, and profitability.
Start your free trial today and see how story-driven analytics can turn your store data into a competitive advantage.