How to Calculate Profit Margin for Your Shopify Brand
Tired of guessing your profits? Learn how to calculate profit margin (gross, net, and contribution) to understand your Shopify store's true financial health.
Here’s the deal: the basic profit margin formula is simple enough. You take your revenue, subtract your total costs, divide that by your revenue, and multiply by 100. Easy.
(Revenue - Total Costs) / Revenue x 100
But for a Shopify founder, the real challenge isn't the math. It’s figuring out what “Total Costs” actually means. It's a messy, fragmented number, buried in dozens of places—from your sourcing invoices and Shopify reports to the last-click cost on a Meta ad and your Klaviyo subscription. Getting an honest answer feels impossible.
Stop Guessing Your Profits and Start Knowing Them
That big, beautiful revenue number in your Shopify dashboard feels good, but it doesn't tell the whole story. What are you really taking home after every cost is accounted for?
For most DTC founders, the answer is a complicated puzzle. Your financial truth is scattered across Shopify reports, ad platform dashboards, COGS spreadsheets, and 3PL statements. Each one lives in its own silo, telling a different part of the story, making it a nightmare to get a clear, reliable view of your profitability.
This data fragmentation is a common trap that leaves you guessing on critical decisions. Are your best-selling products actually profitable after you account for rising shipping costs and ad spend? Is that high-ROAS campaign just a vanity metric, or is it genuinely improving your bottom line and LTV?
Why Profit Margin Is Your Most Important Metric
Getting a handle on your profit margins is the single most important skill for running a healthy DTC brand. It’s the ultimate report card for your business's financial health and the key to improving performance across the board, from ROAS and CAC to retention. The first step is understanding the different types of margins and what they tell you.
- Gross Profit Margin: This tells you if your core product and pricing strategy actually work before you factor in operating costs.
- Net Profit Margin: This is the big one. It’s your true, all-in profitability after every single expense is paid.
- Contribution Margin: This shows you exactly how much cash each sale generates to cover your fixed costs, helping you set a profitable Customer Acquisition Cost (CAC) target.
Mastering these calculations is the difference between reacting to problems and proactively building for growth. For a deeper dive, Headline Marketing Agency has a great guide to help you calculate profit margins for sustainable growth.
For many Shopify founders, the "aha!" moment isn't when revenue hits a new high. It's the first time they see their true, SKU-level profitability. It changes everything about how you think about pricing, AOV, and marketing.
Moving Beyond Manual Spreadsheets
This guide will cut through the noise. We're going to walk through how to calculate the profit margins that actually matter for your DTC brand.
But more importantly, we’ll show you how AI-powered analytics simplifies this entire process, replacing hours of manual data crunching. Imagine a world where you aren’t spending your Sunday night wrestling with spreadsheets. Instead, an AI-powered platform like MetricMosaic automatically unifies all your scattered data, turning that complexity into a clear, actionable dashboard. You get a real-time, story-driven view of your true profitability.
This is how you stop guessing and start knowing. It's how you turn your everyday store data into a competitive advantage.
Calculating Gross Profit Margin to Perfect Your Pricing

Before you dive into optimizing ad spend or fine-tuning your email flows, you need to nail one fundamental metric: your gross profit margin. This is the bedrock of your Shopify store’s financial health. It tells you exactly how much cash you generate from your products before paying for anything else—marketing, salaries, rent, you name it.
Think of it this way: a weak gross margin is like building a house on a shaky foundation. No amount of fancy marketing or operational genius can fix a business that’s losing money on every single sale.
For a little context, this metric is a big deal for investors, too. The average net profit margin for S&P 500 companies has jumped from around 5.85% in the decades before 2015 to nearly 9.75% by 2024. That's a massive shift in corporate profitability, which you can read more about in this deep dive from T. Rowe Price.
For your DTC brand, the formula itself is pretty simple:
Gross Profit Margin = (Revenue - COGS) / Revenue x 100
While the math is straightforward, the real work for founders is pinning down that one critical variable: Cost of Goods Sold (COGS).
The Real Work: Nailing Down Your COGS
For an e-commerce brand, COGS is so much more than what you paid your manufacturer. It’s the sum of every direct cost that gets a product from a factory floor into your customer's hands. Trying to pull this data together manually often means digging through supplier invoices, freight forwarder statements, and customs paperwork. It’s a messy process, and it’s incredibly easy to miss something.
To get your true COGS per unit, you have to account for everything:
- Manufacturing Cost: The baseline price you pay your supplier for each unit.
- Inbound Shipping & Freight: The cost to get products from your manufacturer to your warehouse or 3PL.
- Import Duties & Tariffs: All the lovely taxes and fees for getting goods into the country.
- Packaging Materials: The cost of your mailer boxes, tape, filler, and any custom inserts.
- Fulfillment Labor (sometimes): If you use a 3PL that charges a per-item pick-and-pack fee, this should be included here.
Forgetting just one of these can seriously inflate your perceived profitability, leading you to make bad decisions on pricing, ad spend, and promotions.
A Real-World Shopify Example
Let’s run through an example. Imagine you own a DTC brand called "Aura Candles," and you sell your signature candle for $40. To figure out your gross profit margin, first you have to calculate your true COGS for one candle.
Here's a sample breakdown of what that might look like.
COGS Calculation for a Sample Shopify Product
| Cost Component | Cost Per Unit | Notes |
|---|---|---|
| Manufacturing Cost | $7.50 | The price paid to your supplier for one candle. |
| Inbound Shipping | $1.20 | Prorated cost of shipping a bulk order to your warehouse. |
| Import Duties | $0.45 | Tariff fees divided across the entire shipment. |
| Custom Box & Insert | $1.50 | The cost of your branded packaging materials. |
| Total COGS Per Unit | $10.65 | The true, fully-loaded cost of one candle. |
See how quickly those "small" costs add up? Now, with a true COGS of $10.65, we can finally plug the numbers into our formula.
Let’s do the math:
- Revenue per candle: $40.00
- COGS per candle: $10.65
- Gross Profit: $40.00 - $10.65 = $29.35
- Gross Profit Margin: ($29.35 / $40.00) x 100 = 73.4%
That 73.4% margin is a fantastic number. It means that for every dollar you make in sales, you have about 73 cents left to cover all your operating expenses—marketing, software, salaries—and still have profit left over.
This is exactly the kind of SKU-level clarity that an AI-powered analytics platform like MetricMosaic provides automatically. Instead of hunting through spreadsheets, it connects to your data sources to calculate your true COGS and surface your gross margin in real-time. You can instantly see which products are your profit powerhouses and which might be secretly bleeding you dry, giving you the confidence to perfect your pricing and promotion strategies.
Finding Your True Bottom Line with Net Profit Margin
Gross margin is a great health check, but it only tells you half the story. If you want to know what's really going on with your brand's finances, you have to look at your net profit margin.
This is the number that reveals what’s actually left in your bank account after every single expense is paid. It's the ultimate measure of your business's profitability, zooming out from individual products to assess the health of your entire operation.
It answers the one question that keeps every founder up at night: "Are we actually making money?"
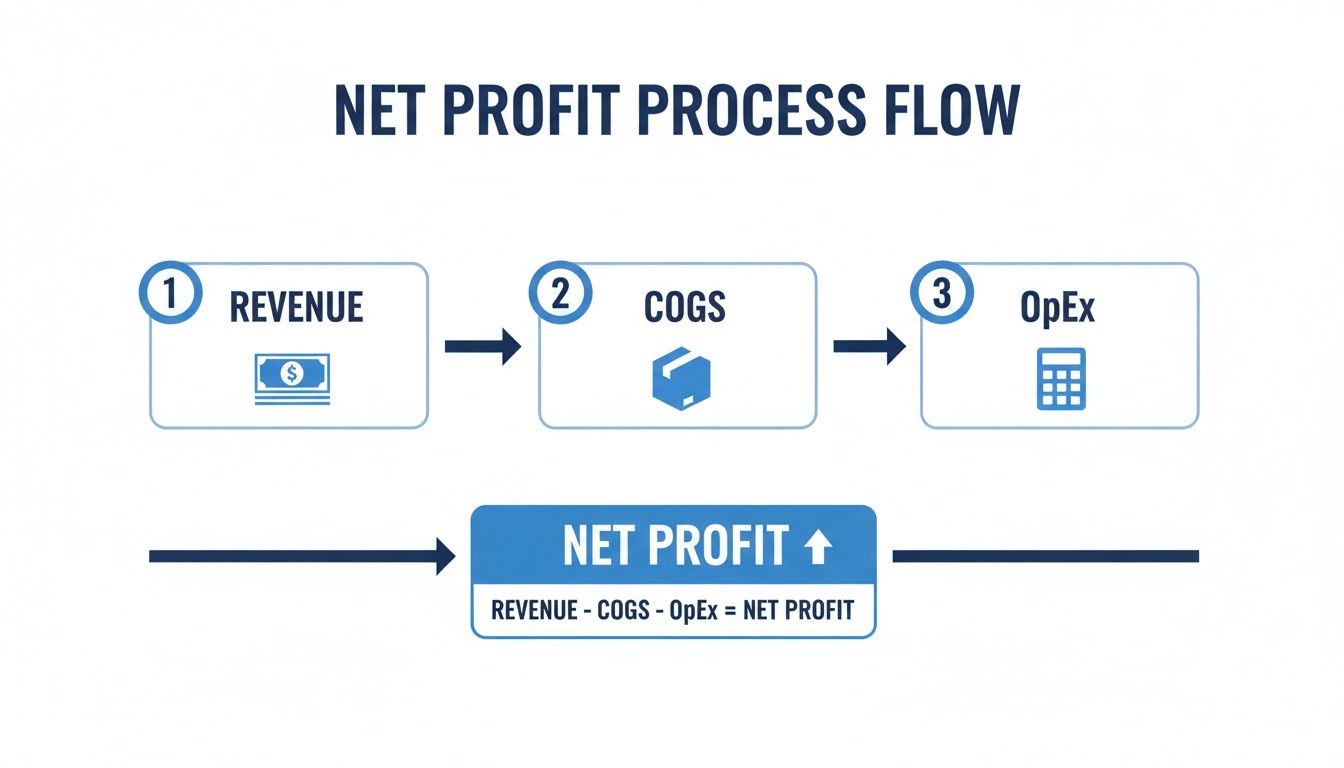
The formula for net profit margin builds on what we've already done, but it adds in all your Operating Expenses.
Net Profit Margin = (Revenue - COGS - Operating Expenses) / Revenue x 100
This is exactly where manual spreadsheets start to completely fall apart for a growing DTC brand. The sheer number of operating expenses (OpEx) is overwhelming. They live in different systems, get updated at different times, and are often a total nightmare to attribute accurately.
The Hidden Costs That Wreck Profitability
For DTC founders, OpEx is a minefield of costs that are way too easy to forget or miscalculate. These are the expenses that can quietly turn a brand with a healthy gross margin into an unprofitable venture, often without you even realizing it until it's too late.
Tracking them accurately isn't optional—it's everything.
Here’s a quick rundown of the most common operating expenses you absolutely have to account for:
- Marketing & Advertising: This is your total ad spend across Meta, Google, TikTok, you name it. It's often your largest and most volatile OpEx and ties directly to your Customer Acquisition Cost (CAC).
- Platform & App Fees: Think your monthly Shopify bill plus the recurring costs for every single app in your tech stack—from Klaviyo for email to your reviews app.
- Salaries & Contractor Fees: Payroll for your team and any payments to freelancers or agencies for things like design, copywriting, or performance marketing.
- Fulfillment & Shipping: The fees from your 3PL, warehousing costs, and the actual price of shipping orders (if you don't bake this into COGS).
- Transaction Fees: Those percentage-based fees that Shopify Payments or other gateways skim off every single order.
- Overhead: This covers rent for your office or warehouse, software subscriptions (like your design tools), and other general business expenses.
Trying to pull these numbers from a dozen different places every month isn't just a grind; it’s a recipe for disaster. This is the exact problem that AI-powered analytics platforms like MetricMosaic were built to solve. By plugging directly into Shopify, your ad platforms, and other tools, it automates all the data crunching to give you a real-time, accurate net profit margin without the spreadsheet headaches.
Putting It All Together: A Real-World Example
Let's go back to our "Aura Candles" brand to see how this works in the real world. We'll say the brand pulled in $50,000 in revenue last month.
- Revenue: $50,000
- COGS: We already figured out a COGS of $10.65 for a $40 candle. To hit $50k in revenue, they sold 1,250 candles, making their total COGS $13,312.50.
- Operating Expenses (OpEx): Now, we add everything else up.
- Marketing Spend (CAC): $12,000
- Shopify & App Fees: $750
- Salaries: $6,000
- Fulfillment & Shipping: $5,500
- Transaction Fees: $1,450
- Total OpEx: $25,700
Let's plug these numbers into our formula:
($50,000 Revenue - $13,312.50 COGS - $25,700 OpEx) / $50,000 Revenue
$10,987.50 / $50,000 = 0.21975
Multiply that by 100, and we see Aura Candles has a net profit margin of 22%.
This is a really solid number. It means that for every dollar in revenue, the business keeps about 22 cents in pure profit. It's important to have some context here, too. Margins vary wildly by industry—the average net profit margin is around 8.5%, but a capital-heavy business like auto manufacturing might only see 3.5%, while finance can hit over 30%. To avoid drawing the wrong conclusions, always compare your numbers to DTC industry benchmarks. You can find more details on industry averages over at VenaSolutions.com.
Knowing this final number is what gives you the power to make smart moves. A low net margin might tell you it's time to cut operational costs, renegotiate with your 3PL, or find more efficient marketing channels. A high net margin, on the other hand, gives you the green light to reinvest in growth, knowing your business model is fundamentally sound.
Using Contribution Margin to Scale Ad Spend Profitably
This is where the rubber meets the road.
If gross and net margins are your strategic, big-picture views, contribution margin is your in-the-trenches, tactical tool. It’s the one metric that truly separates the brands that scale sustainably from the ones that just burn cash on ads.
Why? Because it tells you exactly how much profit each individual sale contributes toward covering your fixed business costs. It cuts through the noise and answers the most critical DTC question: How much can I actually afford to pay to acquire a customer and still make money?
Unlike gross margin, which only backs out COGS, contribution margin goes a crucial step further. It also subtracts all the variable costs tied to that single sale—think payment processing fees, shipping, and, most importantly, your ad spend.
The Formula for Confident Scaling
Calculating your contribution margin per order is what gives you the confidence to turn up the dial on your ad budgets without flying blind. The formula itself is beautifully simple but incredibly powerful.
Contribution Margin = Revenue Per Order - COGS - Variable Costs Per Order
Variable costs are any expenses that fluctuate directly with each sale. The most common ones for a DTC brand include:
- Marketing Spend: The specific ad cost to acquire that one customer (your CAC).
- Transaction Fees: The cut Shopify Payments or PayPal takes from the order.
- Fulfillment Costs: The pick-and-pack fee from your 3PL.
- Shipping Costs: The actual postage you paid to ship that specific package.
This is the metric that keeps you honest. A 4x ROAS feels great, but if your contribution margin is negative after all the real costs are factored in, you're literally paying to give your products away.
A Real-World DTC Example
Let's go back to our Aura Candles brand. They sell a candle for $40, and we already know the COGS is $10.65.
Now, let's layer in the other variable costs for a single order:
- Ad Spend (CAC): Let's say it cost $12 in Meta ads to acquire this specific customer.
- Transaction Fee: On a $40 order, the 2.9% + $0.30 fee comes to $1.46.
- Shipping & Fulfillment: It costs a combined $7.50 to pick, pack, and ship this candle.
Here’s how the contribution margin breaks down for this one sale:
- Revenue: $40.00
- Subtract COGS: -$10.65
- Subtract Variable Costs: -$12.00 (CAC) - $1.46 (Fees) - $7.50 (Shipping)
- Contribution Margin: $8.39
That $8.39 is pure gold. It's the actual cash profit generated from this sale that you can now use to pay for your fixed costs like salaries, rent, and software subscriptions. Knowing this number is the difference between guessing and knowing if your ad spend is actually working.
To make sure your advertising efforts are truly adding to your bottom line, it's essential to calculate Marketing ROI for your campaigns and connect it back to this crucial metric.
The journey from top-line revenue to the bottom-line profit is what truly matters for your brand's health.
Turning Margin Data Into Action
Let's be real: manually calculating contribution margin for every single order is impossible. You'd drown in spreadsheets.
This is where an analytics platform like MetricMosaic becomes your growth co-pilot. It automatically pulls data from Shopify, your ad platforms, and your 3PL to calculate contribution margin in real time—not just per order, but per campaign, per channel, and even per SKU.
Instead of a messy spreadsheet, you get a clear, story-driven dashboard showing you which campaigns are truly profitable and which are just driving revenue at a loss. It lets you make confident, data-backed decisions, ensuring every dollar you pour back into marketing results in more profit, not just more sales.
How AI Delivers Actionable Profitability Insights
Let's be honest, you didn't start a DTC brand to spend your nights buried in spreadsheets. Yet, for so many Shopify founders, that's exactly where they end up—manually pulling data from Shopify, Meta Ads, Google Analytics, and some monster COGS sheet. It's a massive time suck, and it slows down every important decision.
This manual process isn't just a headache; it's dangerously inaccurate. A tiny slip-up in a formula or a forgotten app fee can completely warp your view of profitability. You might end up scaling a campaign that's secretly bleeding money or cutting a product that was actually a winner. This is where modern AI analytics tools completely change the game.
Moving Beyond Static Reports
The old way of tracking profit gives you a static snapshot in time—just a number in a cell. An AI-powered analytics platform like MetricMosaic delivers a live, dynamic view of your business's financial health by automatically plugging into every data source in real time.
That means your Shopify sales data, ad spend from every platform, fulfillment costs from your 3PL, and all those pesky app fees are finally unified into a single source of truth. The result is an always-accurate, real-time calculation of your profit margins—whether you're looking at the whole company, a specific SKU, or even a customer cohort.
Uncovering the "Why" Behind the Numbers
A great analytics tool doesn't just show you what your profit margin is; it explains why it changed. This is the power of turning raw data into a real story.
Instead of just seeing that your net margin dropped from 18% to 14% last week, an AI co-pilot might tell you: "Your net margin decreased by four points. This was primarily driven by a 20% increase in Facebook CPA for your 'Summer Glow' campaign, combined with rising fulfillment costs for orders to the West Coast."
That level of clarity is just impossible to get from a spreadsheet. It transforms a mess of data into a simple narrative, letting you spot problems and opportunities in seconds, not hours. You stop reacting to old reports and start making proactive, strategic moves.
This focus on margin is absolutely critical for long-term health and valuation. For some context, U.S. corporate profit margins hit around 9.5% in 2023, well above the historical average of 6.3%. It just goes to show how central margin forecasting is to modern business strategy. You can read more on this trend in corporate profitability here.
From Predictive Insights to Competitive Advantage
The best platforms don't just look backward; they use your historical data to generate predictive insights. By analyzing trends in your CAC, LTV, and product margins, they can start to forecast future profitability with surprising accuracy.
Imagine your analytics tool giving you a heads-up before a problem even hits:
- "Predictive Alert: Based on current ad spend trends, your top-selling SKU is projected to become unprofitable in the next 10 days. Consider adjusting your bid strategy or promoting a higher-margin alternative."
- "Opportunity: Your repeat customer cohort has an LTV 3x higher than new customers. We recommend reallocating 15% of your acquisition budget to a retention-focused campaign."
This is the real promise of AI-driven analytics. It’s about trading manual data drudgery for automated, conversational intelligence. When you can ask your data questions in plain English and get clear, story-based answers, you turn your store's data into your most powerful competitive advantage—fueling smarter, faster, and more profitable growth.
A Few Common Questions About Profit Margins
Even with all the right formulas, the real world of e-commerce is messy. Once you start digging into your own numbers, new questions always pop up. It's one thing to know the math, but it's another to navigate the reality of fluctuating ad costs, supplier fees, and platform expenses.
Here are a few of the most common questions we hear from founders when they start getting serious about profitability.
What’s a Good Profit Margin for a Shopify Store?
Honestly, there’s no single magic number. A "good" profit margin depends entirely on your niche, your product costs, and your overall business model. A brand selling high-end, custom furniture will have a completely different margin profile than one slinging affordable skincare. It just wouldn't be a fair comparison.
That said, many successful DTC brands aim for a gross margin somewhere in the 50-70% range and a net margin of 10-20%.
The most important thing is to first benchmark against your direct competitors, and then, more crucially, to track your own margins over time. The goal isn't just to hit some arbitrary number—it's to see consistent, sustainable improvement as you grow.
How Often Should I Be Calculating This Stuff?
If you’re stuck wrangling spreadsheets, you’re probably only looking at this stuff monthly, maybe weekly if you're really diligent. In today's e-commerce world, that's just not going to cut it.
A sudden spike in your Meta ad costs or a new shipping surcharge from your 3PL can absolutely torch your profitability in a matter of days. If you're waiting weeks to see the report, the damage is already done.
Your goal should be real-time monitoring. This is where an analytics platform like MetricMosaic comes in. It automates the entire process, giving you an always-on, accurate view of your profitability. This lets you react to changes instantly, not weeks after you've been bleeding cash.
My ROAS Is High, but I’m Not Profitable. Why?
Ah, the classic DTC trap. This is the one that sinks countless promising brands. A high Return on Ad Spend (ROAS) only tells you how much revenue you generated for every dollar you spent on ads. It's a vanity metric because it completely ignores your Cost of Goods Sold (COGS) and every other expense that goes into running your business.
You could be celebrating a fantastic 5x ROAS, but if your gross margin is only 20%, you’re almost certainly losing money on every single sale driven by that ad. Once you factor in shipping, transaction fees, and other overhead, that "profitable" campaign is actually draining your bank account.
This is exactly why you have to move beyond ROAS and start focusing on contribution margin and net profit. These are the metrics that tell the true story of your financial health. They give you the clarity you need to make smart calls on pricing, ad spend, and overall strategy, ensuring every sale actually puts money in your pocket.
Ready to stop guessing and start knowing your true profitability? MetricMosaic is the AI-powered growth co-pilot for Shopify brands that unifies your data and delivers actionable insights in plain English. See your real-time profit margins, understand what's driving them, and get the clarity you need to scale faster.
Start your free trial today at metricmosaic.io and turn your data into your biggest competitive advantage.