How to Calculate CAC Payback for Shopify Founders
Learn how to calculate CAC payback for your Shopify store. This guide breaks down the formula, examples, and strategies to improve DTC profitability.
You're a Shopify founder trying to grow. To figure out your CAC payback period, you just divide your Customer Acquisition Cost (CAC) by your margin-adjusted monthly revenue per customer. It's a simple formula, but it tells you exactly how many months it takes for a new customer to pay for their own marketing cost. Getting this number right is the first real step to building a DTC brand that actually makes money, not just revenue.
Why Most Shopify Stores Misunderstand Profitability

You're spending a ton on Meta and Google ads. Your Shopify "cha-ching" notifications are going off constantly. But when you look at your bank account at the end of the month, the numbers just don't add up. Sound familiar?
This gap between flashy top-line revenue and actual cash in the bank is a classic headache for DTC founders. It's the result of fragmented data spread across Shopify, ad platforms, and a dozen spreadsheets. This blind spot usually points to one massive metric you're not tracking correctly: the CAC Payback Period.
This metric is so much more than basic ROAS or CAC. It answers the single most important question for any Shopify brand trying to scale: How long until my marketing dollars come back to me as actual profit?
The Fuel Gauge for Your Growth Engine
Ignoring your payback period is like driving a car without a fuel gauge. Sure, you're moving, but you have no clue when you’re about to sputter to a halt. A long payback period will absolutely drain your cash reserves, making it impossible to reinvest in inventory, new campaigns, or growing your team.
A healthy business isn't just about acquiring customers; it's about acquiring them profitably and efficiently. Your CAC payback period is the ultimate measure of that efficiency, showing how quickly your growth engine can refuel itself.
The whole concept came out of the subscription software world, where VCs see a payback period under 12 months as a green light for a healthy, scalable business. The really great ones often hit a 5-7 month payback. For a DTC brand on Shopify selling physical goods, the margins are different, but understanding this timeline is just as critical for sustainable growth. You can dig into more benchmarks over on geckoboard.com.
Trying to track this manually is a nightmare. This is exactly where AI-powered analytics tools like MetricMosaic come in. Instead of you crunching numbers, an AI co-pilot connects all your data sources—Shopify, Meta, Google Ads—and delivers a clear, real-time picture of your profitability timeline. No more manual grunt work, just clarity.
The Two Essential Formulas for Calculating CAC Payback
When you're trying to figure out your CAC payback period, you’ll find there isn't a single, one-size-fits-all formula. As a Shopify founder, you really need to get comfortable with two different methods.
There's the simple, blended approach—great for a quick pulse check. Then there’s the more robust, gross margin-adjusted formula, which is what actually shows you the real path to profitability. Let's break down both.
The Simple Blended Payback Formula
This is the most direct way to get a high-level view of your payback timeline. Think of it as a back-of-the-napkin calculation. It’s useful for getting a quick, directional sense of how your marketing is performing without getting bogged down in the details.
Here's the formula:
Simple CAC Payback = Customer Acquisition Cost (CAC) / Average Revenue Per Customer (ARPC)
And here’s what goes into it:
- Customer Acquisition Cost (CAC): Take your total sales and marketing spend for a period (say, a month) and divide it by the number of new customers you brought in during that same time.
- Average Revenue Per Customer (ARPC): This is just your total revenue from new customers in that period, divided by the count of new customers.
While it’s fast, this method has a huge blind spot: it completely ignores the cost of the goods you sold (COGS). By treating all revenue as pure profit, it can paint a dangerously optimistic picture of your financial health. This leads us to the formula that every serious DTC brand should be using.
The Gross Margin-Adjusted Payback Formula
This is the gold standard for Shopify brands. It's how you accurately calculate your CAC payback because it forces you to account for your actual product costs. It tells you exactly how long it takes to recoup your ad spend using only the real profit generated from each sale.
The much better formula is:
Margin-Adjusted CAC Payback = CAC / (ARPC x Gross Margin %)
This introduces one critical new piece:
- Gross Margin %: This is the profit you make on a product before any overhead. The calculation is
(Revenue - Cost of Goods Sold) / Revenue.
By factoring in gross margin, you ground your payback calculation in reality. Ignoring it is one of the most common mistakes I see founders make, and it causes them to completely underestimate how long it truly takes to break even on a new customer.
Let's look at an example. If your CAC is $200 and a new customer generates $25 in monthly revenue, the simple payback is 8 months. But if your gross margin is 80%, the margin-adjusted payback period jumps to 10 months. That’s a massive difference when you're planning cash flow.
As you can imagine, this distinction is crucial. You can find more great insights on this over at maxio.com. Ultimately, the margin-adjusted formula is the only way to get a true measure of your unit economics and build a resilient, scalable business.
Simple vs Margin-Adjusted CAC Payback Calculation
This table breaks down how a hypothetical Shopify store's payback period changes when you account for gross margin. Notice how the "Simple Payback" looks great on paper but hides the real cash flow reality revealed by the "Margin-Adjusted" calculation.
| Metric | Simple Payback (Blended) | Margin-Adjusted Payback (True) |
|---|---|---|
| Customer Acquisition Cost (CAC) | $120 | $120 |
| Average Revenue Per Customer (ARPC) | $30/month | $30/month |
| Gross Margin % | Not Considered | 65% |
| Payback Calculation | $120 / $30 | $120 / ($30 x 0.65) |
| Payback Period | 4.0 Months | 6.2 Months |
As you can see, ignoring COGS gives you a payback period that's over two months shorter than reality. Relying on the simple formula could lead you to scale up unprofitable campaigns, thinking you're breaking even much faster than you actually are. That's a cash flow trap you want to avoid.
Putting It All Together: A Real-World Shopify Example
Theory is great, but let's make this tangible. We'll walk through a scenario with a fictional Shopify store, 'Artisan Roast Collective,' to show you exactly how to calculate your CAC payback period with data you already have.
Artisan Roast Collective sells premium, small-batch coffee beans. Last month, they poured budget into a big Meta ads campaign to acquire subscribers for their new coffee box. Now, the founder needs to know: was that campaign actually profitable? And how quickly will she get her money back?
Gathering the Essential Data
First, we need to pull the raw numbers. This is where it gets messy for most brands, digging through multiple tabs and manually stitching data together. It's exactly the kind of chore that AI-powered analytics platforms are built to automate.
For our example, we'll grab data from three places:
- Meta Ads Manager: Total ad spend for the month was $7,500.
- Shopify Admin (New Customers): They acquired 150 brand new customers during the campaign.
- Shopify Admin (Sales Data): Those 150 new customers generated $11,250 in initial revenue.
- Inventory/COGS Spreadsheet: The Cost of Goods Sold for those orders was $4,500.
With these four data points, we have everything we need to build the calculation from scratch.
Building the Calculation Step by Step
Let's plug these numbers into our trusty gross margin-adjusted formula.
First up, Customer Acquisition Cost (CAC). This is just your total ad spend divided by the new customers you brought in.
$7,500 (Ad Spend) / 150 (New Customers) = $50 CAC
It cost Artisan Roast Collective exactly $50 to acquire each new subscriber. Simple enough.
Next, we need the Average Revenue Per Customer (ARPC). This is the total revenue from those new customers, divided by the number of customers.
$11,250 (New Customer Revenue) / 150 (New Customers) = $75 ARPC
So, each new customer spent an average of $75 on their first purchase.
Finally, we calculate the Gross Margin. This tells us how much profit is left after accounting for the cost of the actual coffee beans.
($11,250 Revenue - $4,500 COGS) / $11,250 Revenue = 0.60 or 60% Gross Margin
For every dollar in revenue, 60 cents is pure profit. This is the fuel that will pay back our ad spend.
This infographic gives you a quick visual of how these pieces fit together.
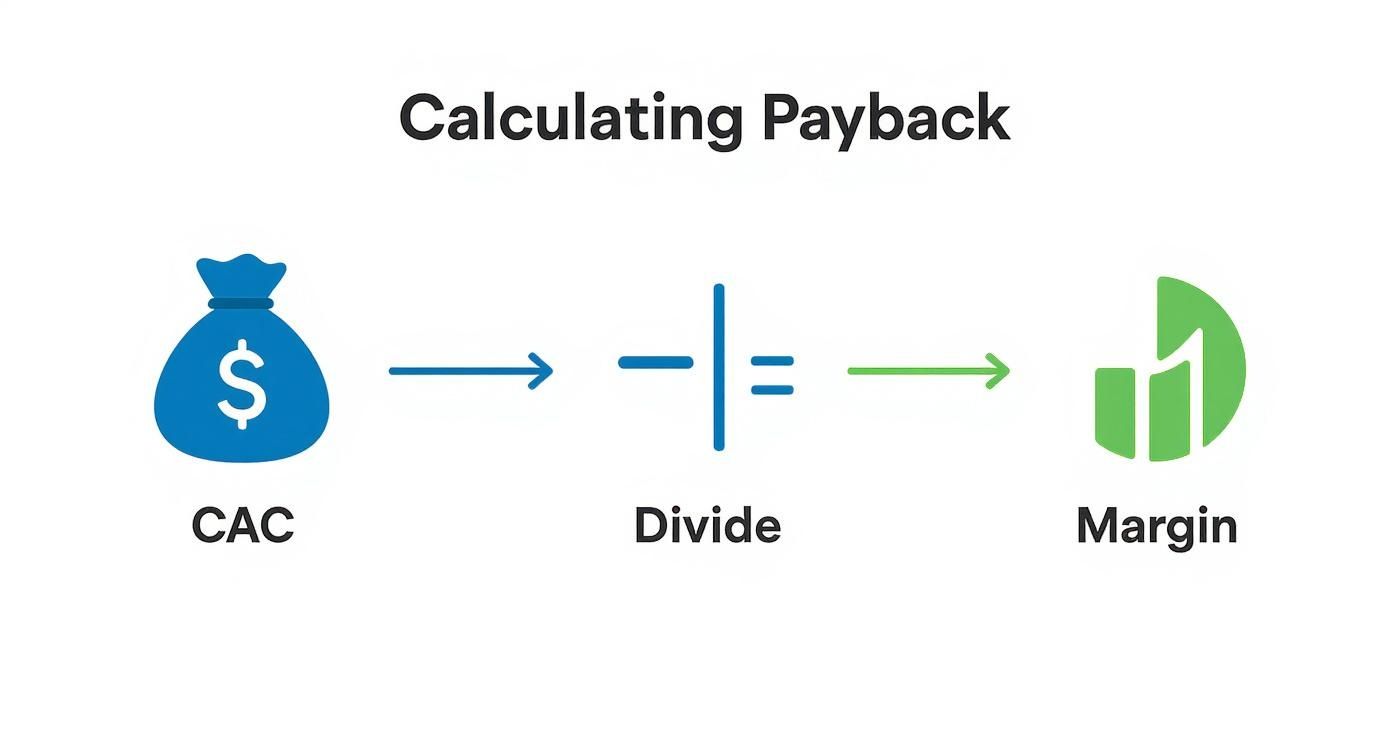
It all flows from our initial CAC, which we then measure against the margin-adjusted revenue to find the true payback timeline.
Determining the Payback Period
Now for the moment of truth. We combine these pieces to find the margin-adjusted payback period.
CAC Payback = CAC / (ARPC x Gross Margin)
$50 / ($75 x 0.60)
$50 / $45 = 1.11 months
The result? It will take Artisan Roast Collective just over one month (1.11 months) to earn back the $50 it spent to acquire each new customer.
This is a very healthy payback period for a DTC brand. It's a clear signal that their Meta campaign was efficient and their unit economics are strong. This kind of clarity is what turns abstract data into a confident decision to scale what’s working.
Go Deeper with Channel and Cohort Payback Analysis
Your blended CAC payback number is a great starting point. Think of it as a vital sign for your Shopify store's overall health.
But the real, actionable insights—the ones that unlock profitable scaling—are buried a level deeper. It's a classic trap. A healthy blended payback of six months might be hiding a dangerously unprofitable TikTok channel with a 15-month payback. That hidden money-pit is being propped up by a stellar Google Ads channel that breaks even in just two months.
Relying only on the average leads founders to pour more money into channels that are secretly bleeding cash. The solution is to get granular and calculate CAC payback for individual marketing channels and specific customer cohorts.
Channel-Level Payback Analysis
This is where you take the same gross margin-adjusted formula and apply it to each marketing channel individually. Instead of lumping everything together, you isolate the spend and acquisitions from a single source.
- Meta Ads Payback: Use only your Meta ad spend and the new customers acquired directly from those campaigns.
- Google Ads Payback: Isolate your Google Ads spend and the corresponding new customers.
- Influencer Payback: Track the costs of an influencer campaign and the customers acquired through their unique code or link.
This segmented view immediately reveals your most efficient growth levers. You might discover that while TikTok brings in cheap traffic, those customers have a low AOV and take forever to become profitable. Meanwhile, your less flashy search ads could be attracting high-intent buyers who pay back their acquisition cost almost immediately.
This granular analysis transforms fragmented data into a clear roadmap. It's no longer about guessing where to allocate your budget; it's about making data-driven decisions to double down on what works and cut what doesn't.
Cohort-Based Payback Analysis
Beyond channels, you can group customers acquired at the same time or under similar circumstances. A cohort is just a group of users who share a common characteristic.
For a Shopify brand, this is incredibly powerful. You could analyze:
- The "Black Friday 2023" cohort to see if discount-driven customers are truly profitable long-term.
- The "January New Year's Resolution" cohort to understand the value of seasonally acquired customers.
- The "Subscribers vs. One-Time Buyers" cohort to see how different business models impact your payback timeline.
This level of detail used to require a dedicated analyst and days spent wrestling with spreadsheets. Now, AI-powered analytics tools like MetricMosaic can automate this entire process. These platforms connect directly to your Shopify and ad accounts, automatically segmenting your data to surface predictive insights. Often, it's as simple as asking a question through conversational analytics.
Industry benchmarks show just how much payback periods can vary. While some early-stage companies see payback in just a few months, larger firms can take up to 20 months as acquisition costs rise. You can explore more SaaS benchmarks at bantrr.com to see how different business models perform.
By digging into your own channel and cohort data, you gain the clarity needed to build a resilient and truly profitable DTC business.
Actionable Strategies to Improve Your CAC Payback
Knowing your CAC payback period is one thing. Actually shortening it is where the magic happens.
A shorter payback timeline pumps cash back into your business faster. That's more money you can immediately reinvest into inventory, marketing, and scaling your brand. To get there, you've got three main areas to focus on: cutting your acquisition costs, getting customers to spend more upfront, and improving retention to boost LTV.
Refine Your Customer Acquisition
The most obvious way to improve your payback period? Spend less to get a customer in the door. This isn’t about just slashing your ad budget—it’s about making every dollar work harder.
First, take a hard look at your ad creative. If you're running the same visuals you were six months ago, it's time for a refresh. Test out new user-generated content (UGC), tweak your messaging, and experiment with different formats like video or carousels.
Next, get serious about your targeting. It's time to move past broad lookalike audiences and zero in on the customer segments that actually drive your business forward. A deep dive into your Shopify data, simplified by AI analytics, will show you which customer profiles have the highest LTV. Aim your campaigns directly at people who look just like them.
Boost Your Average Order Value
The second lever is all about getting more revenue from that very first purchase. The higher a customer's initial AOV, the faster you recoup what you spent to acquire them. This means optimizing every single touchpoint at the point of sale.
Your payback period is a direct reflection of your unit economics. Small improvements in AOV can have a massive, compounding impact on how quickly your marketing spend turns into real profit.
Here are a few tried-and-true tactics we see working for DTC brands:
- Smart Bundles: Don't just sell a face wash; sell "The Perfect Morning Routine" kit. Grouping complementary products together at a slight discount is an easy win for AOV.
- Tiered Discounts: Nudge customers to spend a little more. Think: "Spend $75, get 10% off; spend $100, get 15% off."
- One-Click Post-Purchase Upsells: This is a game-changer. Use a Shopify app to offer a relevant add-on after the initial checkout is complete. It’s a frictionless way to bump up the order value without getting in the way of the original conversion.
Strengthen Customer Retention
Finally, never forget that the payback calculation depends on the profit a customer generates over time. Keeping them around longer is one of the most reliable ways to speed up profitability and increase your LTV.
This is where your email and SMS marketing really shines. A well-crafted welcome series, exclusive offers for past buyers, and a simple loyalty program can work wonders for getting that second and third purchase.
Every repeat purchase contributes more gross margin toward paying off the initial CAC, effectively shrinking your payback period without you spending another dime on ads. This is how you build a resilient, cash-flow-positive brand.
Answering the Tough Questions on CAC Payback
When you're a DTC founder, the moment you start digging into CAC payback, a few big questions bubble up almost immediately. It's totally normal. Nailing down the answers is what turns this metric from a fuzzy concept into a practical tool for making smarter calls on ad spend, pricing, and cash flow.
Let's walk through the most common questions we hear from Shopify brands every day.
What’s a Good CAC Payback Period for a DTC Brand?
For most ambitious, high-growth DTC brands, hitting a CAC payback period under 6 months is the gold standard. That kind of speed means your marketing dollars are cycling back into the business fast, fueling growth without you having to constantly chase outside capital.
A payback window of 6-12 months is still considered healthy, especially if you know your customers stick around and have a high lifetime value (LTV). But if you find your payback period stretching past the 12-month mark, it's time to pay attention. That’s often a red flag for deeper issues—maybe inefficient ad spend, weak margins, or leaning too hard on discounts. All of these will drain your cash and make it incredibly hard to scale.
How Does LTV Fit In with CAC Payback?
Think of CAC Payback and Lifetime Value (LTV) as two sides of the same profitability coin. You really can't understand one without the other. They work together to paint the full picture of your customer economics.
- CAC Payback tells you when you break even on a new customer.
- LTV tells you how much profit that customer will generate over their entire time with you.
A sustainable brand needs both to be in good shape. You could have an amazing LTV, but if it takes two years to actually see that value, you might not have enough cash to survive the wait. The magic formula is a strong LTV:CAC ratio (aim for 3:1 or higher) combined with a quick payback period. That’s how you build a business that can afford to acquire more of those great, high-value customers.
I like to put it this way: LTV is your ultimate destination, and CAC payback is your fuel efficiency. You need a worthwhile destination and enough gas in the tank to get there.
Why Is My CAC Payback Period So Long?
When we see a long payback window, it almost always comes back to one of three culprits. First is a high Customer Acquisition Cost (CAC). This is the obvious one, usually driven by inefficient ad spend, the rising costs of platforms like Meta or Google, or just getting drowned out by competition.
Second is a low Average Order Value (AOV). This happens when new customers just aren't spending enough on their first purchase to make a real dent in what you paid to acquire them.
But the third reason is often the most critical: low gross margins. If your cost of goods is too high, there’s simply not enough profit from each sale to pay back your marketing spend quickly. This is precisely why looking at your margin-adjusted payback isn't just a nice-to-have—it's essential for building a resilient brand.
Stop wrestling with spreadsheets and start getting answers. MetricMosaic is the AI-powered analytics co-pilot for Shopify that unifies your data and surfaces clear, actionable insights on CAC payback, LTV, and profitability. Discover the story your data is telling you at https://www.metricmosaic.io.