How to Calculate Average Revenue for Shopify: The Founder's Guide
Learn how to calculate average revenue for your Shopify store. This guide breaks down AOV, ARPU, and LTV into actionable steps for smarter DTC growth.
As a Shopify founder, you're probably drowning in data. You see daily sales flash in your dashboard, ROAS numbers from your Meta ads, and open rates from Klaviyo. But honestly, those are just scattered puzzle pieces. You're trying to connect the dots between fragmented reports, but you're left wondering if a big revenue day was a fluke or a trend, or if that expensive ad campaign is actually paying for itself in the long run.
This is where understanding average revenue metrics completely changes the game. Calculating average revenue sounds simple enough—dividing total revenue by a quantity like customers or orders. But mastering this moves your Shopify brand from guesswork to data-driven growth. It helps you get past surface-level vanity numbers and answer the questions that really matter:
- Are my customers spending more per order this quarter than last?
- Which marketing channels are bringing in the highest-value customers over their lifetime?
- Is that new product bundle really increasing my average cart size and profitability?
The basic formula is a business standard for a reason. Taking your Total Revenue (TR) and dividing it by a specific Quantity (Q) transforms raw sales data into a powerful diagnostic tool for your DTC brand. If you want to dive deeper into the history behind the metric, VerifiedMetrics.com has a great breakdown.
Before we dig into the specific formulas, here's your cheat sheet for the key average revenue metrics that will become your north star for profitable growth.
The Key Average Revenue Metrics for Shopify Brands
| Metric | What It Measures | Why It Matters for Growth |
|---|---|---|
| Average Order Value (AOV) | The average dollar amount spent each time a customer places an order. | Shows if you're successfully boosting profitability per transaction through bundles, upsells, or shipping thresholds. A higher AOV directly improves ROAS. |
| Average Revenue Per User (ARPU) | The average revenue generated from each unique customer over a specific period. | Helps you understand the true value of your customer base, not just individual transactions. It's a key indicator of customer relationship health. |
| Customer Lifetime Value (LTV) | Tracks how much a customer cohort is worth over their entire lifecycle. | Reveals your most valuable customer segments and the long-term effectiveness of your retention efforts, directly impacting your CAC payback period. |
Each of these metrics provides a different lens to view your business's health and profitability, helping you make smarter decisions about everything from marketing spend to product development.
The Real Challenge: Fragmented Data
Let's be honest, the math isn't the hard part. The real headache for DTC founders is getting the data in the first place. You’re trying to pull clean revenue numbers from Shopify, match them to customer profiles in Klaviyo, and then somehow reconcile all of that with session data from Google Analytics. It’s a manual, error-prone nightmare that can eat up hours.
This is precisely where next-gen, AI-powered analytics platforms transform complexity into clarity. Instead of you exporting another CSV, they automatically connect these disparate sources, replacing manual data crunching with a single source of truth.
This infographic gives you a simple visual for how that process works—from messy, scattered data to a clear, actionable insight.
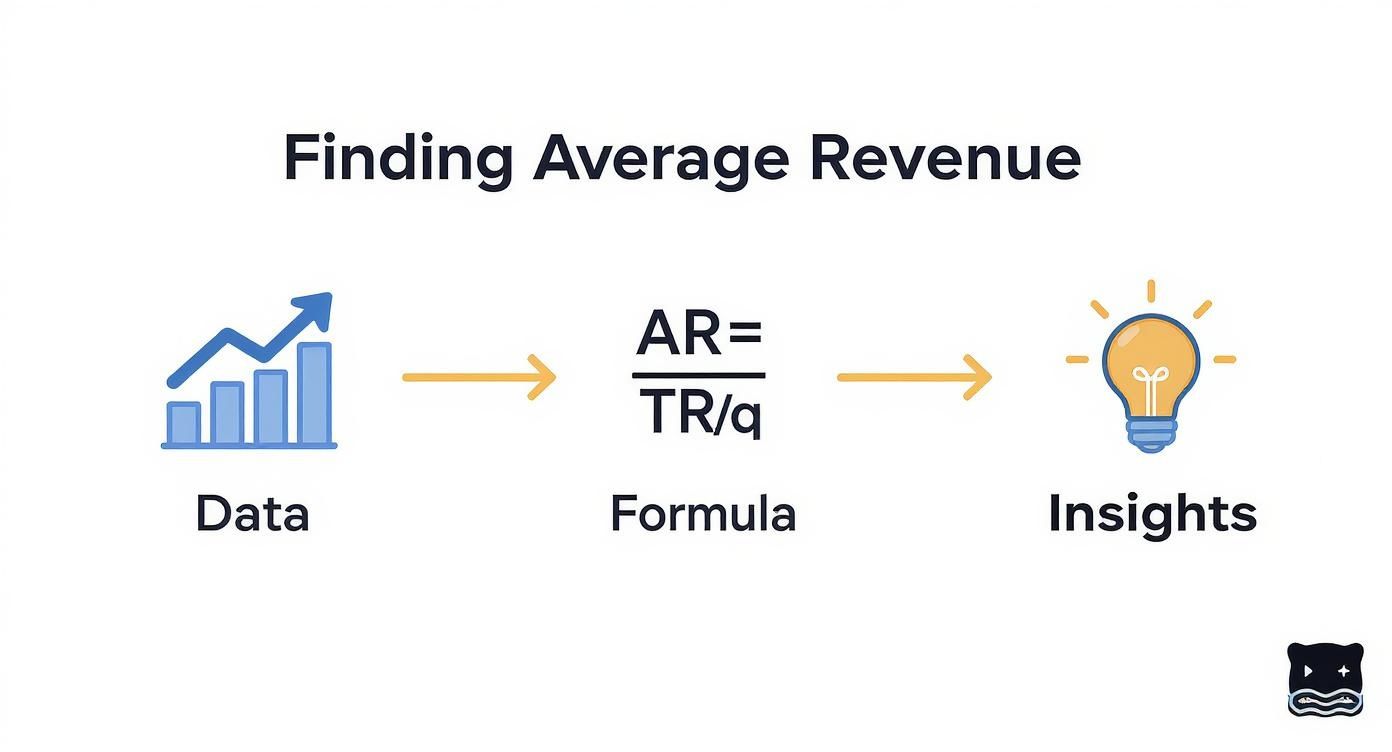
The goal is to let AI-driven tools do the heavy lifting. That way, you can spend your time on what actually matters: making smart decisions that improve your AOV, LTV, and overall profitability.
Calculating Average Order Value: Your Quick-Win Metric
For most founders on Shopify, Average Order Value (AOV) is the first "real" metric they sink their teeth into after mastering daily sales. It’s straightforward, incredibly impactful, and gives you an immediate pulse on the transactional health of your store.
AOV answers a simple but critical question: when customers check out, how much are they spending on average?
The formula itself couldn't be simpler:
AOV = Total Revenue / Total Number of Orders
This is a quick-win metric because even a small bump in your AOV can have a massive impact on your bottom line—without you needing to spend a dime more on customer acquisition. When AOV goes up, your Return on Ad Spend (ROAS) and profitability get a nice lift too, since you're making more from the same ad-driven traffic.
The Manual Grind of Finding Your AOV
If you're doing this by hand, you’d head to the Reports section in Shopify, pull a Sales report, and divide Total sales by Orders. Seems easy enough, right? But this is where unreliable reports can lead you astray.
A few common tripwires I see all the time:
- Returns and Refunds: Does your "Total sales" number account for returns? If not, you're calculating AOV based on inflated revenue, giving you a false sense of security.
- Canceled Orders: These often hang around in the data, skewing your order count and making your AOV look lower than it is.
- Shipping and Taxes: Are you including shipping fees and taxes? It's crucial to be consistent. Most brands I work with calculate AOV based on net sales to get a true picture of product revenue.
Getting this wrong means you’re making strategic decisions—like setting ad budgets or creating product bundles—based on flawed data. A tiny error can lead to costly mistakes.
For those comfortable with code, a SQL query is cleaner:
SELECT
  SUM(total_price) / COUNT(DISTINCT order_id) AS average_order_value
FROM
  shopify_orders
WHERE
  financial_status = 'paid'
  AND cancelled_at IS NULL;
This snippet ensures you're only looking at paid, non-canceled orders—a much more reliable way to calculate your true AOV.
Founder-to-Founder Tip: Your AOV isn't just a number; it's a direct reflection of your merchandising effectiveness. If AOV is flat, it's a sign you're leaving money on the table with every transaction.
How AI Unlocks AOV Insights Instantly
This is exactly where the manual approach becomes a real grind and where an AI-powered analytics platform like MetricMosaic changes the game. Instead of you pulling, cleaning, and double-checking data, an AI co-pilot does the heavy lifting in real-time.
It syncs with your Shopify store, automatically weeds out noise like refunds and canceled orders, and serves up a clean, accurate AOV.
But here’s what really matters: it moves beyond the "what" to reveal the "why." An AI tool can instantly show you which marketing channels, discount codes, or products are driving your highest (or lowest) AOV. It transforms a simple metric into a clear, actionable roadmap, telling you exactly where to focus to get customers to add one more item to their cart, boosting both AOV and ROAS.
Mastering Average Revenue Per User for Deeper Insights

While AOV gives you a snapshot of a single transaction, Average Revenue Per User (ARPU) tells a much richer story about your customer relationships and retention.
Think of it this way: AOV is how much a customer spends right now. ARPU reveals how valuable each customer is to your brand over time. This shift from a transactional view to a relational one is absolutely critical for building a profitable DTC brand that lasts.
The calculation seems simple on the surface:
ARPU = Total Revenue (in a given period) / Total Unique Customers (in that same period)
When your ARPU is climbing, you know you're getting customers to return and spend more—a clear signal that your retention marketing and customer experience are hitting the mark. It shows the true value you deliver, impacting long-term profitability and LTV.
The Founder’s Headache: Unifying Customer Data
This is where nearly every Shopify founder hits a wall. To get an accurate ARPU, you need a clean, definitive count of your unique customers. But your customer data is scattered everywhere:
- Shopify: Has purchase history but misses email-only subscribers.
- Klaviyo: Tracks every subscriber, but many haven't bought anything yet.
- Google Analytics: Shows anonymous users, making it a mess to connect them to paying customers.
Trying to manually pull CSVs and reconcile these lists is a nightmare of duplicate profiles and mismatched emails. This data fragmentation is one of the biggest hidden blockers to improving LTV and retention.
A customer who buys once for $150 (a great AOV) is less valuable than a customer who buys three times for $75 each (a great ARPU). Don't let a focus on single transactions blind you to the power of repeat business.
How AI Creates a Single Customer View
This is where AI-powered analytics platforms like MetricMosaic become so essential. Instead of you stitching together messy spreadsheets, the platform automatically connects to your Shopify, Klaviyo, GA4, and other tools.
AI de-duplicates and merges these fragmented profiles, creating a single, unified view for every customer. That means you get a real-time, accurate ARPU without lifting a finger. The system handles the complex data reconciliation, freeing you up to focus on retention strategy.
This concept isn't just for eCommerce. The SaaS world relies on a similar metric—Average Revenue Per Account (ARPA)—to gauge customer value. For instance, a subscription company with $200,000 in monthly revenue from 2,000 accounts has an ARPA of $100. The core principle is identical: understand the average value of each relationship. You can dig deeper into how other businesses use these numbers with these insights on financial metrics at HiBob.com.
Predicting Future Growth with Lifetime Value

So far, we’ve focused on what’s already happened. But to truly scale your Shopify brand, you have to shift from looking in the rearview mirror to confidently mapping out the road ahead.
This is where predictive insights become a game-changer. By tracking average revenue over specific timeframes, you can start to predict future growth. Watching how customer groups—or cohorts—spend over their first 30, 60, and 90 days lets you build an incredibly accurate forecast of their total Customer Lifetime Value (LTV), the ultimate metric for profitability.
The Manual Grind of Cohort Analysis
If you're still wrestling with spreadsheets, calculating LTV is genuinely painful. To get a 90-day LTV, you’d need to export all the customers acquired in January. Then, you'd have to track every single purchase made by that exact group through April, constantly cross-referencing order data.
It’s a brutal, time-sucking process begging for errors. You spend hours just to get a single, static number that’s already old news.
A Quick Guide to Cohort LTV:
- Isolate a Cohort: Group new customers from a specific timeframe (e.g., your Black Friday campaign).
- Track Cumulative Revenue: Add up all revenue generated only from that specific group over set intervals (30, 60, 90 days).
- Calculate Average Revenue: Divide that cumulative revenue by the total number of customers in the cohort.
This approach gives you a sharp picture of how much a customer is worth at different stages, which is critical for figuring out how fast you can recoup your Customer Acquisition Cost (CAC).
From Spreadsheets to Story-Driven Predictions
This forward-looking analysis isn't new; it has roots in financial planning. Techniques like moving averages have been used for decades to project performance. If you want to dive into the fundamentals, HubiFi offers a great overview of these classic revenue projection methods.
But today’s next-gen tools take this concept to a whole new level. Instead of losing your weekend in a spreadsheet, you can now use conversational analytics to simply ask your data a direct question.
Imagine typing into a platform like MetricMosaic: "What is the projected 90-day LTV for customers we acquired during the Black Friday campaign?"
In seconds, you get a clear, data-backed answer. The AI co-pilot instantly segments the cohort, tracks their spending, and hands you a predictive insight that would have taken days to uncover manually. This is how story-driven data turns complexity into a competitive advantage.
Turning Your Average Revenue Numbers into Action
Knowing your numbers is a great start, but real growth kicks in when you act on them. Calculating average revenue isn't about filling a spreadsheet; it's about diagnosing what's working and where the biggest opportunities are to improve AOV, LTV, and retention.
Knowing your AOV is $85 is trivia. Knowing why it’s $85—and what levers you can pull to get it to $95—is where the magic happens.
Low Average Order Value? Time to Get Tactical.
If your AOV is lean, the mission is clear: get every customer to add just one more thing to their cart. This is one of the fastest ways to boost your profitability and ROAS without spending more on traffic.
Here are a few battle-tested tactics for your Shopify store:
- Smart Shipping Thresholds: Ditch "free shipping on everything." Instead, set your free shipping threshold about 15-20% higher than your current AOV. It’s a simple nudge that works wonders.
- Strategic Product Bundling: Create bundles that solve a complete problem. A skincare brand could offer a "Morning Routine" kit with a cleanser, moisturizer, and serum. It increases the perceived value and the cart size.
- Frictionless Post-Purchase Upsells: Use a good Shopify app to offer a relevant, one-click add-on after the initial purchase is complete. You capture more revenue without risking the original sale.
Stagnant ARPU and LTV? Focus on Retention.
When your ARPU or LTV numbers aren't climbing, it’s a flashing red light that you’re not building lasting customer relationships. The focus needs to shift from the single transaction to the entire customer journey and repeat purchases.
This is where your email and loyalty marketing become your superpowers:
- Actually Personalized Email: Move past generic blasts. Use your customer data in a tool like Klaviyo to send campaigns that feel personal, like replenishment reminders or new products in a previously purchased category.
- A Loyalty Program That Matters: Reward your best customers with a tiered VIP program. Perks like early access to sales or exclusive gifts make them feel seen and encourage them to consolidate their spending with your brand.
This is where the right tool changes the game. Instead of just showing you a metric, an AI-powered platform like MetricMosaic delivers a story. It might tell you, "Customers who buy Product X are 3x more likely to also buy Product Y." Boom—there's your next high-impact bundle. That's how data stops being a report and starts being a growth strategy.
Your Action Plan for Boosting Average Revenue
So, how do you connect these metrics to real-world actions on your Shopify store? This table breaks down the "if this, then that" for turning insights into profitable growth.
| If This Metric Is Low... | Focus On This Tactic | Example Shopify Implementation |
|---|---|---|
| Average Order Value (AOV) | Increase items per order | Implement a "free shipping over $100" banner. Use an app like Rebuy to create "Shop the Look" bundles to improve AOV. |
| Average Revenue Per User (ARPU) | Boost customer lifetime value | Launch a tiered VIP loyalty program with Smile.io that rewards repeat purchasers with exclusive discounts to improve LTV. |
| Customer Lifetime Value (LTV) | Improve purchase frequency | Set up automated "win-back" and "replenishment" email flows in Klaviyo for customers who haven't purchased in 60 days to boost retention. |
Think of these as your starting playbook. Once AI-driven analytics show you which metric needs attention, you have a clear set of tactics to test, measure, and iterate on.
From Manual Spreadsheets to Automated Clarity
Let's be real. The journey from piecing together AOV to forecasting LTV is a brutal grind when you're doing it by hand. You're constantly exporting CSVs from Shopify, fighting with pivot tables, and trying to make sense of fragmented data from Klaviyo and GA4.
This manual data-wrangling is the old way of doing things. It leaves you with static, rearview-mirror reports that are often stale the moment you finish them. As a founder, you're forced to bet on ad spend, inventory, and retention strategies using numbers that are incomplete at best and flat-out wrong at worst.
Supercharge Your Founder's Intuition
Modern analytics doesn't replace your gut feeling—it supercharges it with accurate, real-time data stories. An AI-powered platform automates the tedious work of data collection and calculation, freeing you up to focus entirely on strategy.
Instead of spending hours figuring out how to calculate average revenue, you can spend seconds asking smarter questions:
- "Which marketing channel brought in customers with the highest 90-day LTV last quarter?"
- "Show me the AOV for first-time buyers who used our welcome discount."
- "What products are most frequently purchased together by our repeat customers?"
You didn't start a DTC brand to become a spreadsheet wizard. You started it to build something people love. The right tools give you the freedom to get back to that mission, armed with the clarity that every decision is backed by data.
It's time to move past the limitations of manual spreadsheets. The competitive edge in eCommerce today comes from how fast you can turn your store's data into smarter actions that improve AOV, LTV, and profitability.
When you can instantly see the story behind your numbers, you stop reacting to the past and start building the future.
Stop crunching numbers and start making smarter decisions. See how MetricMosaic, Inc. can turn your fragmented Shopify data into a clear roadmap for profitable growth. Start your free trial today.