Essential Client Retention Metrics for Shopify Growth
Stop losing customers. Learn the essential client retention metrics that reveal your Shopify brand's health and unlock predictable, profitable growth with AI.
You're running killer ad campaigns on Meta. The Shopify "cha-ching" notification is music to your ears. Top-line revenue is climbing. So why does your actual profit feel... flat?
If that hits a little too close to home, you're not alone. You've got a classic "leaky bucket" problem, something that keeps countless DTC founders up at night. You're pouring new customers in the top, but your hard-won existing customers are quietly slipping out through holes in the bottom. This endless cycle of acquiring and losing is exhausting—and incredibly expensive.
The answer isn't always more ad spend. It’s about plugging the leaks with smarter data. This is where client retention metrics become your secret weapon for profitable growth.
Why Your Shopify Store Has a Leaky Bucket
For far too long, DTC growth has been all about acquisition. But the Shopify brands that win in the long run know that sustainable, profitable growth comes from building a loyal base of customers who buy from you again and again.

Shifting Focus From Acquisition to Retention
Stop thinking of retention metrics as boring numbers buried in a spreadsheet. Start seeing them for what they are: clear signals from your customers, telling you exactly what’s working and what isn’t.
The financial upside here is staggering. A modest 5% increase in retention can boost your profits anywhere from 25% to 95%. That's because it costs up to seven times more to land a new customer than to keep one you already have. You can discover more insights about customer retention statistics from TryPropel.ai.
To really grasp this shift, let's look at the two mindsets side-by-side.
The Shift from Acquisition-Only to Retention-Focused Growth
| Growth Approach | Acquisition-Only Focus | Retention-Focused Strategy |
|---|---|---|
| Primary Goal | Maximize new customer count | Maximize Customer Lifetime Value (LTV) |
| Key Metric | Cost Per Acquisition (CAC) | Retention Rate, LTV, Repeat Purchase Rate |
| Budget Allocation | Heavily skewed towards top-of-funnel ads | Balanced between acquisition and post-purchase experience |
| Customer View | A transaction to be completed | A relationship to be nurtured |
| Long-Term Impact | High churn, dependence on ad spend, thin margins | High loyalty, organic growth, strong profitability |
Seeing it laid out like this makes the path to sustainable growth pretty clear, doesn't it? It’s about building a business that doesn't just survive on the next ad campaign but thrives on genuine loyalty.
From Raw Data to a Clear Story
Of course, knowing you should track these metrics and actually doing it are two different things. Manually crunching these numbers from your Shopify data is a nightmare that most founders just don't have time for. This is where AI simplifies analytics.
AI-powered analytics platforms like MetricMosaic completely change the game. Instead of you spending hours hunting for clues in raw data, an AI co-pilot does the heavy lifting. It transforms complex numbers into a clear, story-driven narrative you can actually use to improve performance across ROAS, LTV, and profitability.
This next-gen approach lets you understand what your customers are really doing, so you can:
- Pinpoint which products are your repeat-purchase heroes.
- Discover which marketing channels bring in the most loyal, high-value customers.
- Leverage predictive insights to see which customers are at risk of churning before they actually leave.
By focusing on these metrics, you stop reacting and start building. You move from an expensive, acquisition-obsessed mindset to a proactive, retention-driven strategy. This is how you turn your everyday Shopify data into a real competitive advantage.
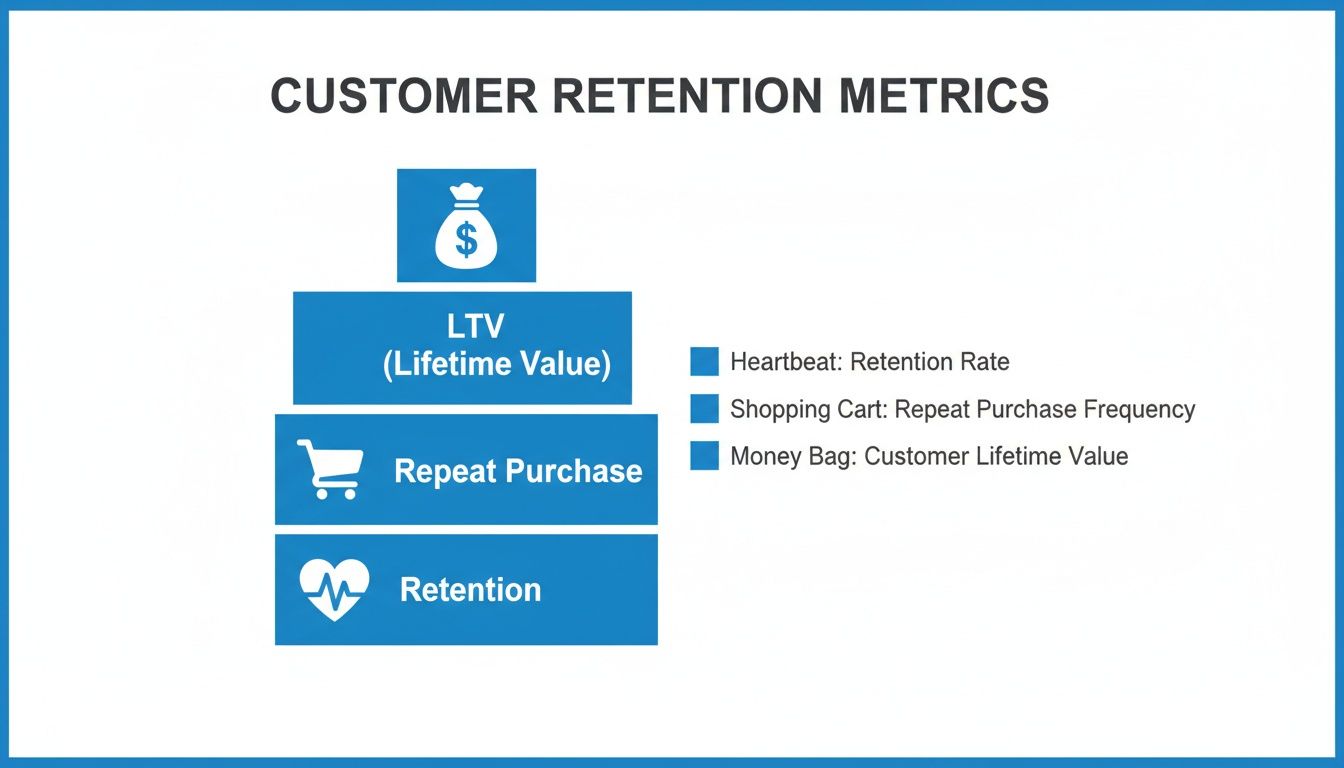
The Four Vital Signs of Customer Retention
Let's cut through the analytics noise. As a Shopify founder, you could get lost tracking dozens of different numbers, but most of them are just distractions. If you want to really understand the health of your business, you only need to focus on a handful of vital signs—the core client retention metrics that tell you if you're building a sustainable brand or just spinning your wheels.
Think of these four as your business's pulse, blood pressure, temperature, and respiration rate. When they're healthy, you're in a great position to grow. When they're off, they’re an early warning sign, letting you diagnose a problem before it becomes critical. Manually calculating these used to be a painful spreadsheet exercise, but AI-powered analytics tools now put them right at your fingertips.
This dashboard from MetricMosaic visualizes these four core metrics, transforming raw Shopify data into an immediate, actionable health check for your brand.
From this single view, you can instantly see your retention rate trending up, identify a recent dip in repeat purchases, and understand the direct relationship between LTV and churn. It’s all about making faster, smarter decisions to improve profitability.
Customer Retention Rate (CRR): Your Brand’s Health Score
This is the big one. Your Customer Retention Rate (CRR) measures the percentage of customers who stick around over a specific period. It’s a direct reflection of how happy people are with your products and the entire Shopify experience you've created. A high CRR is proof you're building a brand people want to come back to.
How to Calculate It (The Old Way):
CRR = [ (Customers at End of Period - New Customers Acquired) / Customers at Start of Period ] x 100
For a fast-moving DTC brand, tracking your CRR monthly provides the perfect balance. It’s frequent enough to spot meaningful trends without getting bogged down by daily noise.
Repeat Purchase Rate (RPR): The Engine of Recurring Revenue
While CRR gives you the big picture, your Repeat Purchase Rate (RPR) gets specific about buying behavior. It simply tracks the percentage of your customers who have made more than one purchase. This metric is the lifeblood of a healthy Shopify store because repeat buyers are your most profitable segment.
A strong RPR proves you've nailed product-market fit and built a post-purchase experience that actually encourages people to buy again. It’s the first real sign that you're building a brand, not just a one-hit-wonder.
How to Calculate It (The Old Way):
RPR = (Number of Customers with >1 Purchase / Total Number of Customers) x 100
Look at this metric monthly as well. It’s also smart to check it weekly after major sales events like BFCM to see if those new buyers are sticking around.
Customer Lifetime Value (LTV): The True Worth of a Customer
Customer Lifetime Value (LTV or CLV) is a forecast of the total revenue you can expect from a single customer over their entire relationship with your brand. It’s the ultimate measure of long-term success, shifting your focus from one-off transactions to the ongoing value of loyalty. When you know your LTV, you know exactly how much you can afford to spend on your Customer Acquisition Cost (CAC).
How to Calculate It (The Old Way):
LTV = (Average Order Value) x (Average Purchase Frequency) x (Average Customer Lifespan)
Calculating this one manually is a headache, which is why AI-driven tools are so valuable here. A quarterly review of your LTV is perfect for strategic planning and seeing the real impact of your retention efforts on profitability.
Customer Churn Rate: The Silent Killer of Profitability
Churn Rate is the flip side of your retention rate. It measures the percentage of customers who stop buying from you over a given period. It might feel like a negative metric, but it's one of the most powerful diagnostic tools you have for your Shopify store. A rising churn rate is a flashing red light—a clear signal that something is wrong.
How to Calculate It (The Old Way):
Churn Rate = (Customers Lost During Period / Customers at Start of Period) x 100
Like CRR, tracking your churn rate on a monthly basis is the best practice. It gives you a consistent pulse on customer satisfaction and helps you react quickly when you see that number start to creep up.
Advanced Metrics for Scaling Your DTC Brand
Once you've got the vital signs of your Shopify store under control, it's time to bring in the specialist tools. While the core four metrics give you a health check, this next level of client retention metrics provides the deep diagnostic insights you need to really scale profitability.
These aren't for everyday monitoring. Think of them as the advanced scans you run to uncover specific growth opportunities and build a genuinely profitable brand for the long haul. Moving beyond simple averages to this deeper level of analysis is what separates the good Shopify brands from the great ones.
Cohort Retention Analysis: Uncovering Hidden Trends
A simple, store-wide retention rate is a blended average, and averages can hide the most important details. Cohort retention analysis fixes this by grouping customers who all made their first purchase in the same time period (like the "November 2023 Cohort" or "BFCM 2023 Cohort"). From there, you just track how each specific group behaves over time.
This approach is incredibly powerful for a DTC brand. It helps you answer the real questions:
- Did the customers we acquired during our holiday sale (with a high CAC) stick around longer than the ones from our summer campaign?
- Are customers who first bought Product X more loyal than those who started with Product Y?
- Did that new post-purchase email flow actually improve retention for the cohorts who received it?
By isolating these groups, you move from vague assumptions to concrete evidence about what truly drives loyalty. You could try to build these charts manually in a spreadsheet, but it's a nightmare. This is where AI-powered tools like MetricMosaic come in, automating the process and turning raw Shopify data into a clear visual story you can understand in seconds.
CAC Payback Period: Managing Your Cash Flow
Every Shopify founder knows that acquiring customers isn't free. The Customer Acquisition Cost (CAC) Payback Period answers one of the most critical cash flow questions there is: "How long does it take for a new customer to generate enough profit to cover what I spent to get them?"
A shorter payback period means you get your marketing investment back faster, freeing up cash to reinvest in growth. A long payback period can strangle your finances, even if your other metrics look healthy. For any scaling DTC brand, this is a non-negotiable metric because it directly ties your marketing spend to actual profitability.
Why It Matters: Understanding your CAC Payback Period prevents you from scaling an unprofitable acquisition strategy. It ensures your growth is sustainable, not just a top-line vanity metric fueled by burning cash.
Tracking this helps you optimize your ad channels. You might find that while Google Ads has a higher CAC, those customers have a much shorter payback period than customers from TikTok, making it a far more efficient channel for profitable growth.
This infographic breaks down how these different pieces of sustainable retention fit together.
As you can see, focusing on repeat purchases and overall retention is the engine that drives a higher Customer Lifetime Value—the ultimate goal for any brand that wants to be around for the long term.
Customer Satisfaction (CSAT) and NPS: Measuring Sentiment
The numbers tell you what is happening, but they don't always tell you why. That's where qualitative metrics like Customer Satisfaction (CSAT) and Net Promoter Score (NPS) come in. They measure customer sentiment directly, giving you the story behind your data.
- CSAT: This is usually a simple, post-interaction survey asking customers to rate their satisfaction with a specific experience, like a support ticket or the checkout process. It gives you immediate feedback on key touchpoints.
- NPS: This one asks customers, "On a scale of 0-10, how likely are you to recommend our brand to a friend?" It gauges overall brand loyalty and is a solid predictor of future growth through word-of-mouth.
For a Shopify brand, these aren't just "nice-to-have" metrics. They are your early warning system. A dip in your NPS score can signal a future rise in churn rate long before it ever shows up in your sales data. Integrating this feedback helps you get ahead of problems and understand the "why" behind your other client retention metrics.
How to Read Your Retention Data with Confidence
You’ve got the numbers in front of you—your Customer Retention Rate, your Repeat Purchase Rate, your LTV. But what do they actually mean?
A 35% repeat purchase rate might be phenomenal for a Shopify store selling high-ticket furniture, but it could be a massive red flag for a brand selling daily consumables like coffee.
This is where context becomes your most valuable asset. Without it, your client retention metrics are just numbers on a screen. With context, they become a compass, telling you exactly where your brand stands and where you need to go next.
Benchmarking Your Shopify Store’s Performance
Understanding industry benchmarks is the first step in turning raw data into strategic insight. It helps you set realistic goals and know which wins are worth celebrating.
For example, knowing the average retention for your specific industry is critical. Recent data shows that media and professional services lead the pack with an impressive 84% retention rate. In stark contrast, the hospitality, travel, and restaurant industries struggle with just 55%.
Retail clocks in at 63%, while e-commerce is even lower at 38%—a number that really highlights the intense challenge of online competition. You can read the full research about customer retention rates on Exploding Topics.
This context is everything. If your DTC brand hits a 40% retention rate, you’re not just doing okay—you're outperforming the average for your sector. That's a huge win worth building on.
eCommerce & Retail Retention Benchmarks at a Glance
| Metric | Average Benchmark for eCommerce | What This Means for Your Shopify Store |
|---|---|---|
| Customer Retention Rate | ~38% | If you're above this, you're doing well at keeping customers coming back in a very competitive space. |
| Repeat Purchase Rate | 20-40% | A healthy rate here means your product and initial experience are strong enough to earn a second sale. |
| Customer Lifetime Value (LTV) | ~$168 (varies wildly by niche) | This is your North Star for ad spend. A higher LTV gives you more room to acquire new customers profitably. |
| CAC Payback Period | Under 12 months | Aim to recoup your acquisition cost within a year. Shorter is always better for cash flow and profitability. |
These numbers give you a solid starting point for comparison, but remember they are averages. The real magic happens when you dig into what the numbers are telling you about your own business.
From Numbers to Actionable Takeaways
Benchmarks provide a baseline, but the real power comes from interpreting what these numbers mean for your business. Instead of just chasing a number, you can start to diagnose specific friction points in your customer journey.
Let's break down what to look for with a few key metrics:
- Low Repeat Purchase Rate: This often signals a problem with the initial product experience or a weak post-purchase follow-up. Are customers getting what they expected? Are you giving them a compelling reason to return?
- Below-Average LTV: If your Customer Lifetime Value is lagging, it could mean you're not successfully upselling or cross-selling. Your customers buy once but aren't exploring the rest of your catalog.
- High Churn After First Purchase: This is a classic sign of a mismatch between your marketing promises and the actual product reality. It suggests your CAC is high and you're acquiring the wrong type of customer.
By connecting a specific metric to a potential business challenge, you can move from "Our numbers are low" to "We need to improve our post-purchase email flow to boost our repeat purchase rate." That's the shift from simply reporting on data to acting on it.
Automating Competitive Analysis with AI
Manually hunting for these benchmarks and piecing together a competitive analysis is a time-consuming project most Shopify founders simply can't afford. This is another area where an AI-powered analytics platform like MetricMosaic creates a massive advantage.
Instead of you doing the research, the AI co-pilot does it for you. It automatically contextualizes your performance against relevant industry benchmarks, turning what was once a manual research task into an instant, actionable insight. It’s a bit like conversational analytics—you get the answers you need in plain English. For example: "Your repeat purchase rate is 15% higher than other DTC apparel brands of a similar size, but your LTV is trailing by 10%. Consider creating product bundles to increase AOV on the second purchase."
This automated analysis closes the loop between data and decisions, giving you the confidence to know not only how you're doing but also exactly what you should do next to improve your key client retention metrics.
Actionable Strategies to Improve Retention Today
Data is useless if it doesn't lead to action. Now that you know the what and the why behind your client retention metrics, it's time for the fun part: making those numbers move in the right direction. Here are practical, actionable takeaways designed for busy Shopify operators.
Each strategy ties directly back to a specific metric we've covered, so you can pick your focus and get to work building a more loyal customer base—and a more profitable business.

Boosting Your Repeat Purchase Rate (RPR)
A low RPR is almost always a symptom of a weak post-purchase experience. They bought once, but you didn't give them a compelling reason to come back. Let's fix that.
1. Nail Your Post-Purchase Email Flow
A generic "Thanks for your order" email is a missed opportunity. Instead, build a simple automated sequence in Klaviyo or your email platform that actually provides value.
- Day 1 (Immediately after purchase): Send a quick, personal thank-you from the founder. Include care instructions for the product they just bought.
- Day 7: Check in. Make sure they received their order and are happy with it. Proactively ask for feedback.
- Day 21-30 (Timing depends on your product): This is your moment for a targeted cross-sell or replenishment email. If they bought shampoo, now’s the perfect time to offer the matching conditioner.
2. Create an Exclusive SMS Club
SMS open rates are in a league of their own. Use this channel sparingly but powerfully. Set up a "VIP SMS Club" for past customers and send them offers they can't get anywhere else—like early access to a new drop. This makes them feel like insiders, a massive driver for repeat business.
Increasing Customer Lifetime Value (LTV)
Growing LTV boils down to getting customers to buy more often or getting them to spend more each time. The best approach tackles both by focusing on loyalty and raising your Average Order Value (AOV).
For DTC brands, increasing LTV isn’t about squeezing every last dollar from a customer. It’s about delivering so much value that they want to spend more with you over time.
1. Launch a Simple, Engaging Loyalty Program
This doesn't need to be complex. A basic points-based system is a fantastic start. For every dollar spent, customers earn points they can redeem for discounts or free shipping. It gamifies shopping and gives them a real reason to choose your brand over a competitor.
2. Build Strategic Product Bundles
Dive into your Shopify data and see which products people frequently buy together. Package them up as a "bundle and save" offer. It's a classic tactic for a reason: it instantly lifts your AOV while introducing customers to more of your product line.
Reducing Customer Churn Rate
High churn is the silent killer of profitability. The key is to shift from a reactive "what happened?" mindset to a proactive one. And for Shopify brands, this is where AI has become a total game-changer.
Use AI to Predict and Prevent Churn
Modern analytics platforms like MetricMosaic use predictive insights to analyze thousands of data points—purchase frequency, time since last purchase, support ticket history, and more—to assign a churn risk score to every single customer.
This isn't just another report; it's an early-warning system. The AI can tell you, "These 150 customers are showing behaviors that match past customers who churned. They are at high risk of leaving."
This insight allows you to take immediate, targeted action:
- Launch an Automated "Win-Back" Campaign: Automatically enroll high-risk customers into a special email and SMS flow designed to remind them why they chose your brand in the first place.
- Offer Proactive Customer Service: Your support team can reach out to these customers before they have a problem. A simple check-in or a surprise gift can completely reset a fading relationship.
By using predictive AI to spot at-risk customers, you stop guessing and start intervening with precision. This proactive approach is one of the most powerful ways to improve your client retention metrics and plug the leaks in your revenue bucket.
Your Top Retention Questions, Answered
Jumping into a new world of metrics can feel like a lot, especially when you’re already spinning a dozen plates running your Shopify store. Here are clear, straight answers to the most common questions from founders.
How Often Should I Actually Be Looking at This Stuff?
For a DTC brand that’s always in motion, the trick is finding a rhythm that gives you real insight without making you jump at every tiny blip.
- Monthly Review: This is your core pulse check. Look at your Customer Retention Rate (CRR) and Churn Rate every month to catch trends before they become problems.
- Weekly Check-in (During Campaigns): During a big sale, keep a closer eye on your Repeat Purchase Rate (RPR) to see if that wave of new customers is sticking around.
- Quarterly Strategy: Review heavier-hitting metrics like LTV and Cohort Analysis every quarter to guide bigger decisions, like where to put your marketing budget next season.
Of course, AI-powered dashboards can automate this whole process, serving up the right insights at the right time.
What’s the Real Difference Between Retention and Loyalty?
This is a great question. The simplest way to think about it is this: retention is the action, loyalty is the feeling behind it.
Retention is a metric—a customer buys from you again. Loyalty is a behavior—they actively choose you over a competitor, forgive you when you make a mistake, and tell their friends about you.
You can brute-force retention with a subscription, but you can only earn true loyalty by delivering a killer product and an even better experience. Tracking client retention metrics helps you figure out which of your actions are building that genuine, profitable loyalty.
I'm Just Starting Out. Which Metric Matters Most?
When you’re just getting your Shopify store off the ground, one metric tells you more than any other: your Repeat Purchase Rate (RPR).
Sure, LTV is the end game, but RPR is your immediate report card. It answers the most important question: "Did they like it enough to come back?" A strong RPR is the first real sign you've found product-market fit and that you’re building a real business, not just selling a one-off novelty.
Can I Just Calculate These Metrics in Shopify?
You can get some of the basics from Shopify's built-in analytics, but when you want to dig into more powerful client retention metrics—like cohort curves, a true LTV, or your CAC payback period—you're usually in for a world of pain. It means exporting CSVs and fighting with spreadsheets, which is not only a massive time-sink but also super easy to mess up.
This is exactly where AI-powered analytics platforms come in. They connect directly to your Shopify store, do all the heavy lifting automatically, and serve up insights in dashboards and stories you can actually understand. It’s about trading hours of manual work for clear, reliable answers that help you grow faster.
Ready to stop guessing and start growing with clarity? MetricMosaic is the AI-powered analytics co-pilot built for ambitious Shopify brands. It pulls all your data together, automates your reporting, and tells you the story behind the numbers so you can boost retention and profit. Start your free trial at metricmosaic.io and see what your data is trying to tell you.